About me
UX Designer with an emphasis on UX Research and methods.
I can code, understand technology, AI, LLMs, cloud, front-end, etc.
Skilled in designing AI-powered SaaS and RAG-based AI agents. Built MVPs.
A cumulative 10+ years of work experience, with 6 years of UX Design and Research
Education & Professional Journey
Bachelor’s in Computer Science
👨💻 Started as an ITSM consultant and developer (BMC Remedy ~ Zendesk Explore) for 3.5 years
🎓 Master’s in Human–Computer Interaction – Indiana University Bloomington (2018)
🇺🇸 Worked in the U.S. as a UX Designer & Researcher across various industries. 6 years
🚘 𝓕𝓸𝓻𝓭 → Grew into a UX Project Lead, driving UX strategy and impactful solutions across multiple initiatives
Why UX?
What Drives Me
Making people’s lives better
Delightful experiences
Strengths
Strong HCI foundations
Systems Thinking
Code, AI, Foundations
UX Design & Research
Attention to detail and analysis
Product Strategy
Stakeholder Alignment
Cross-functional collaboration
Vikas Jangam | PLG Related Work Samples
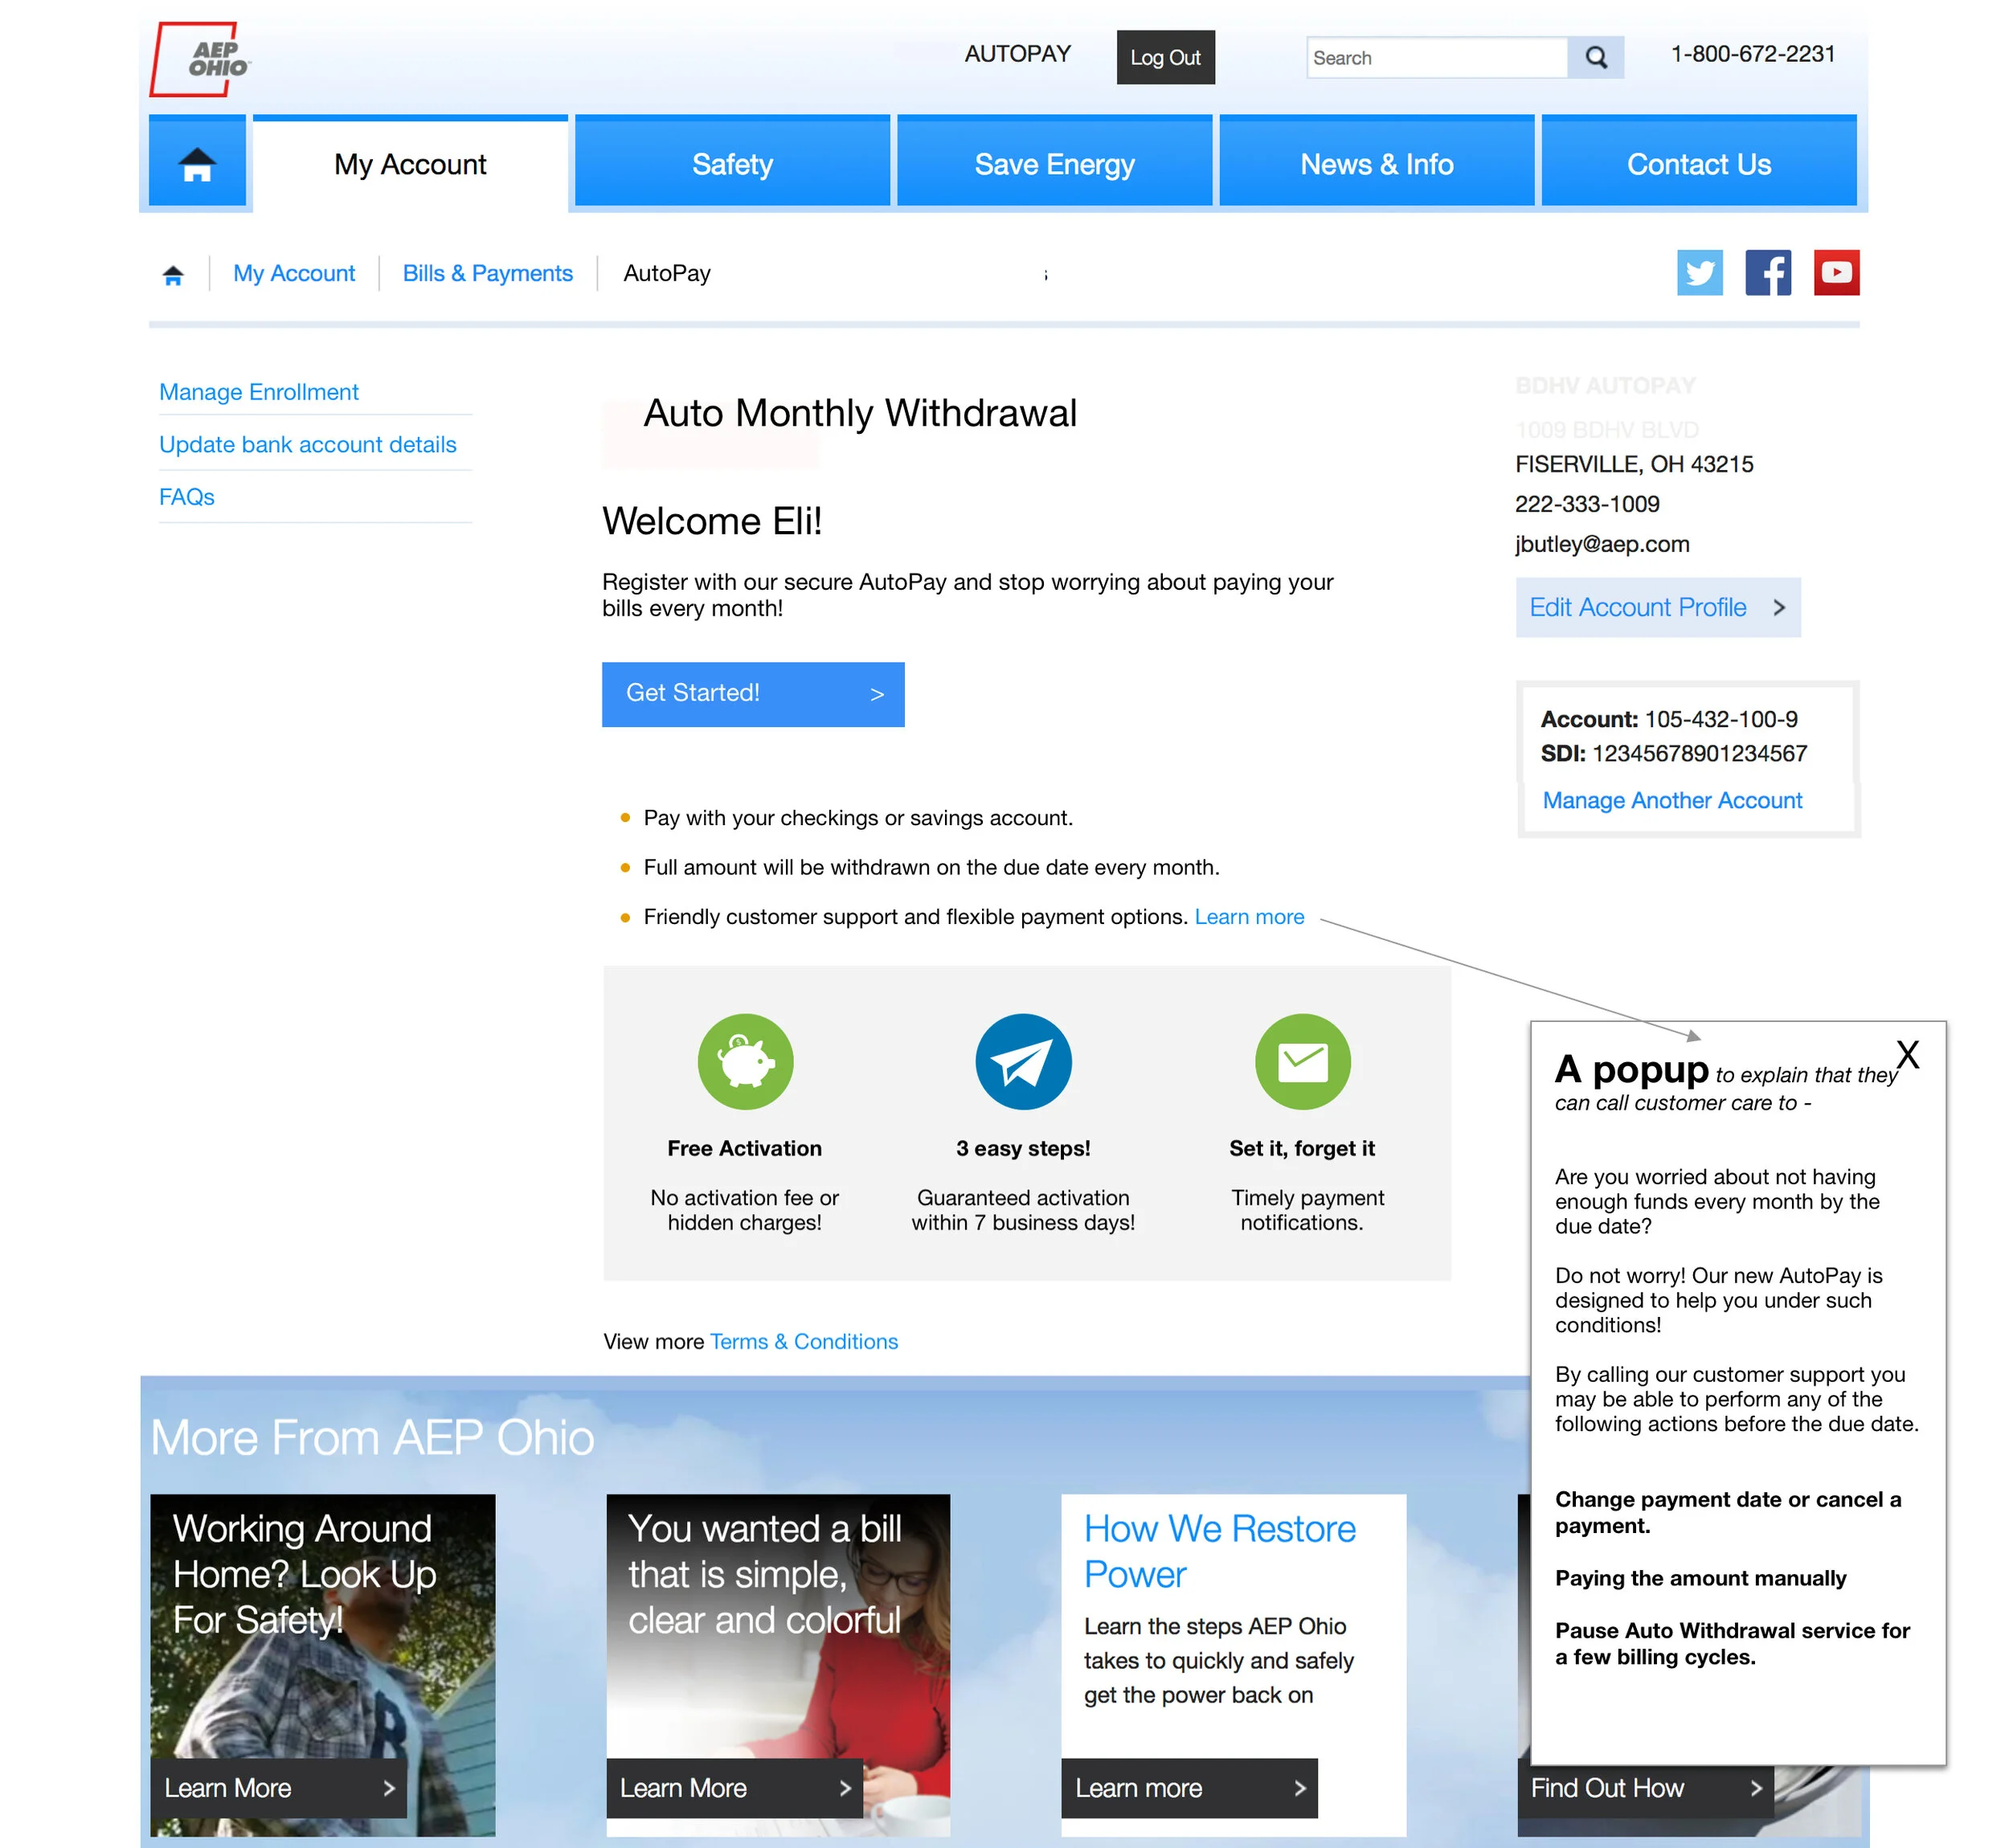
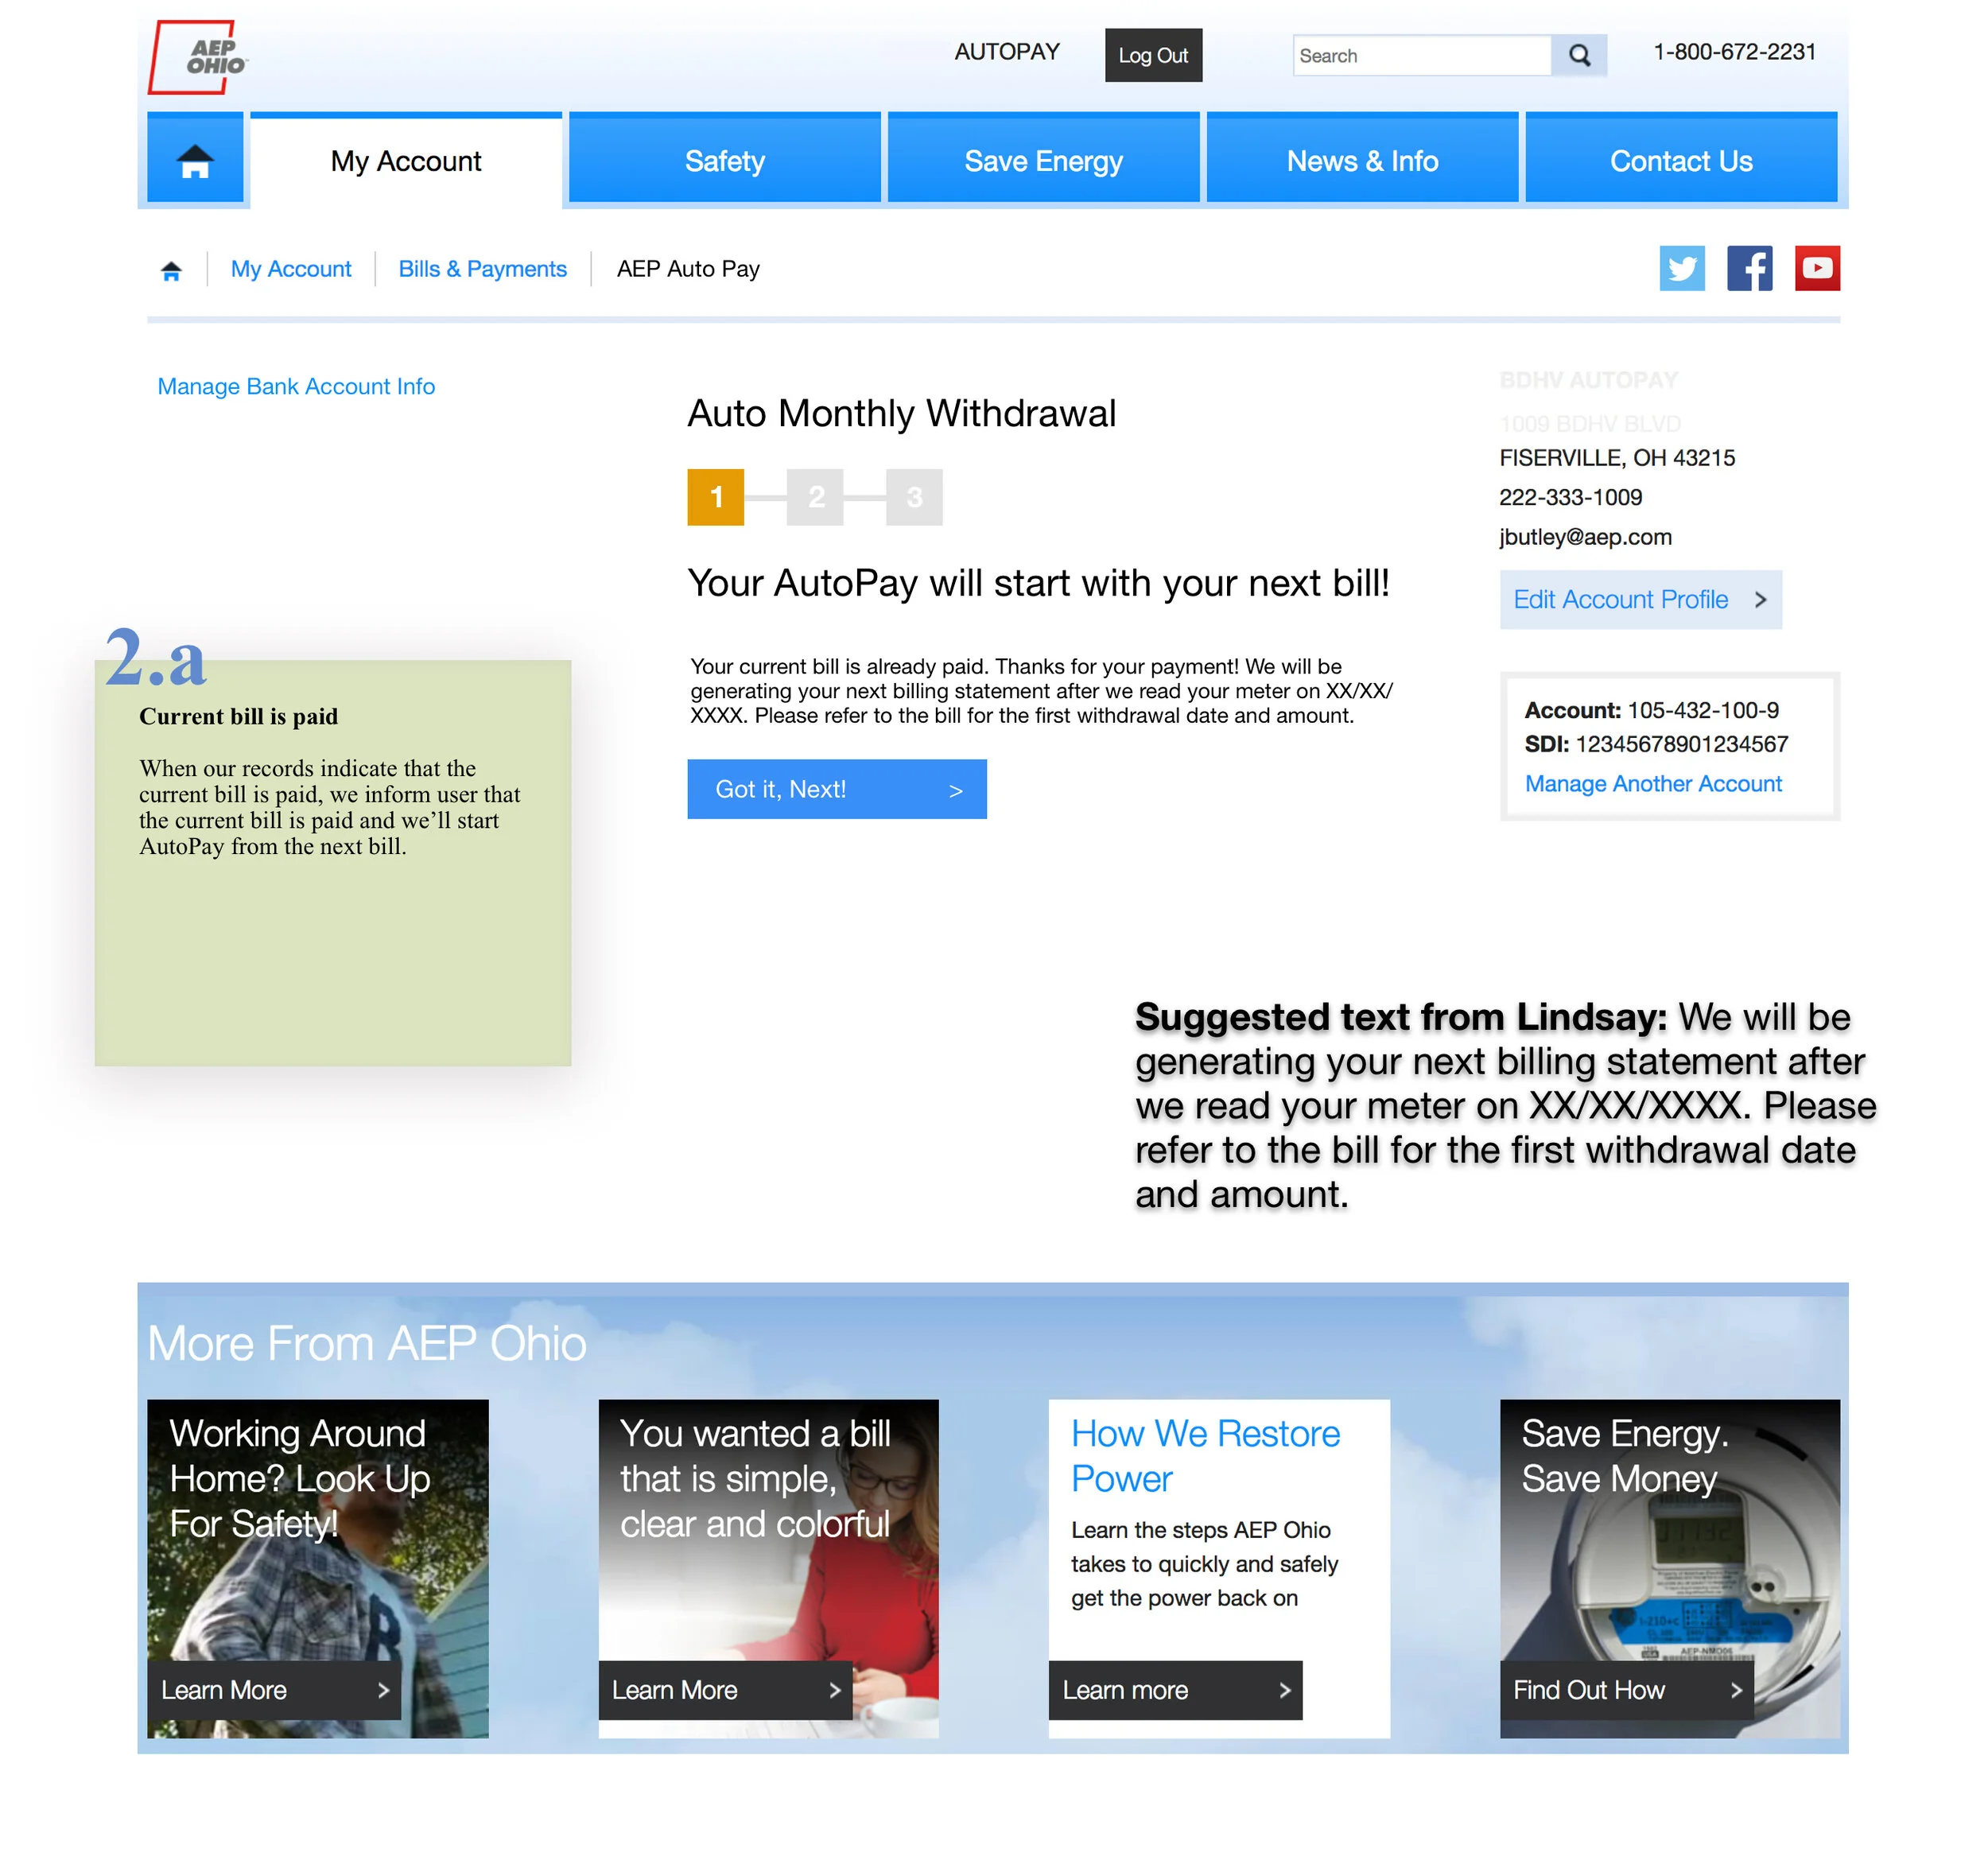
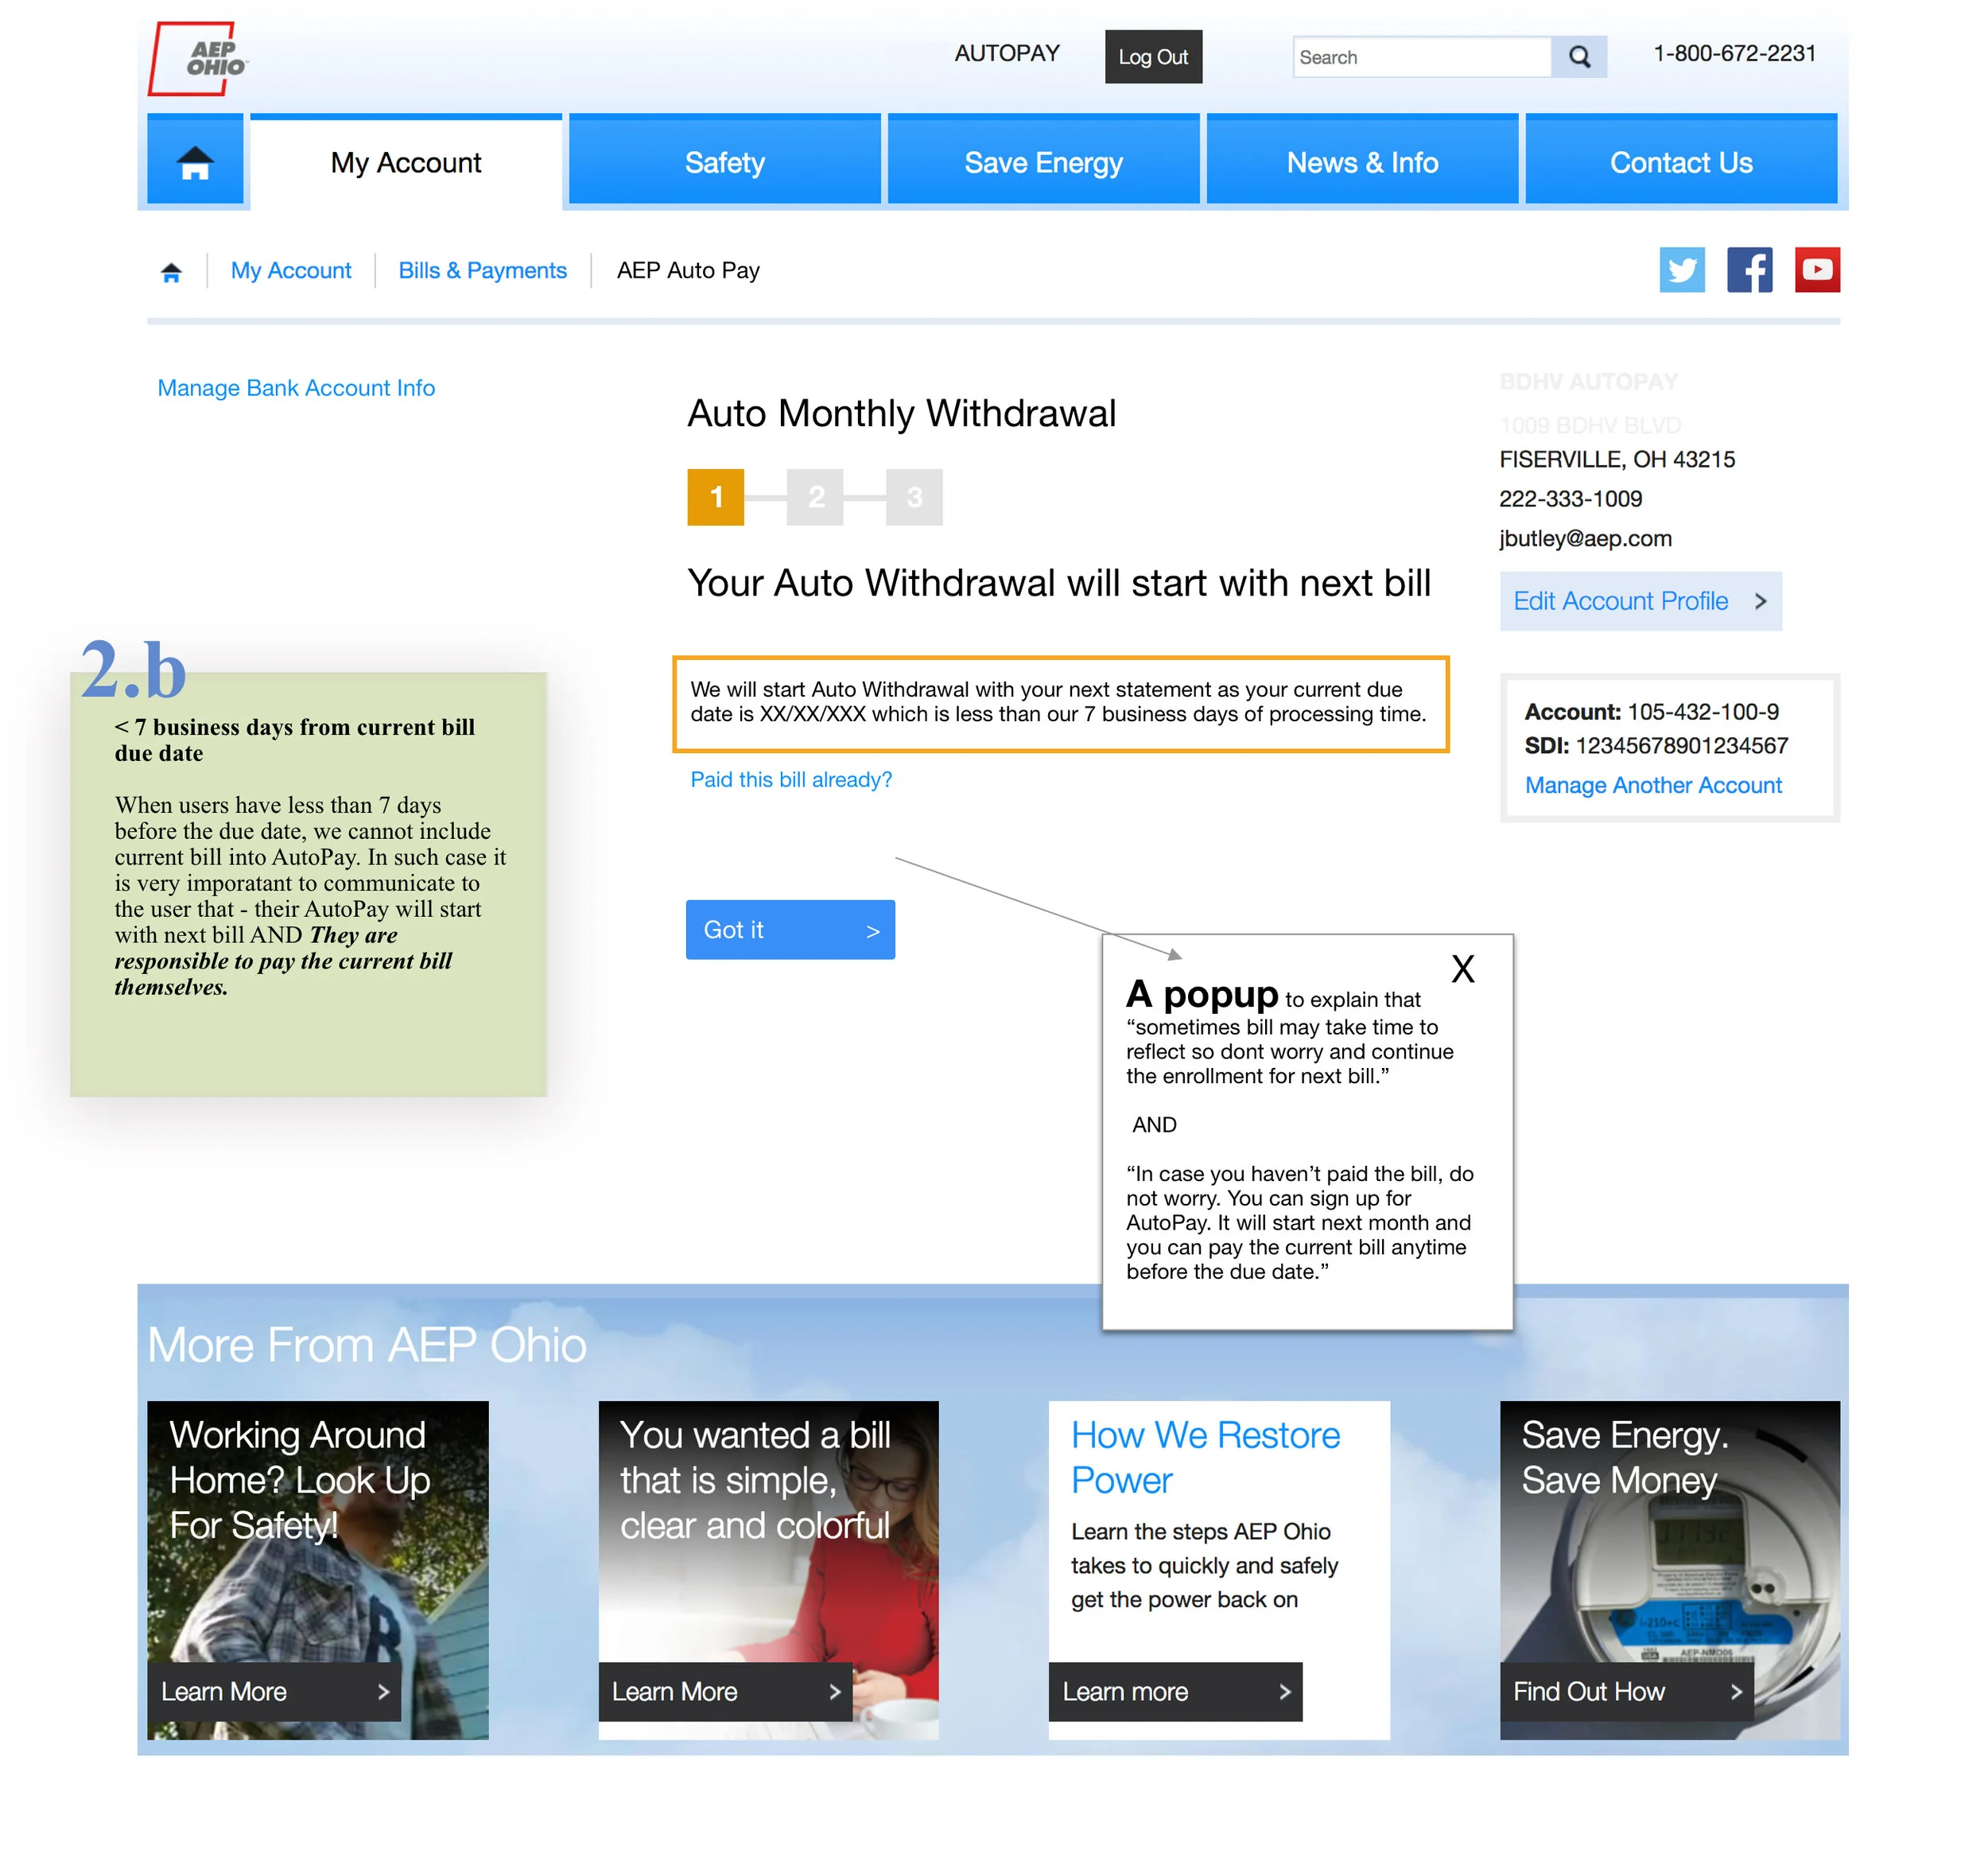
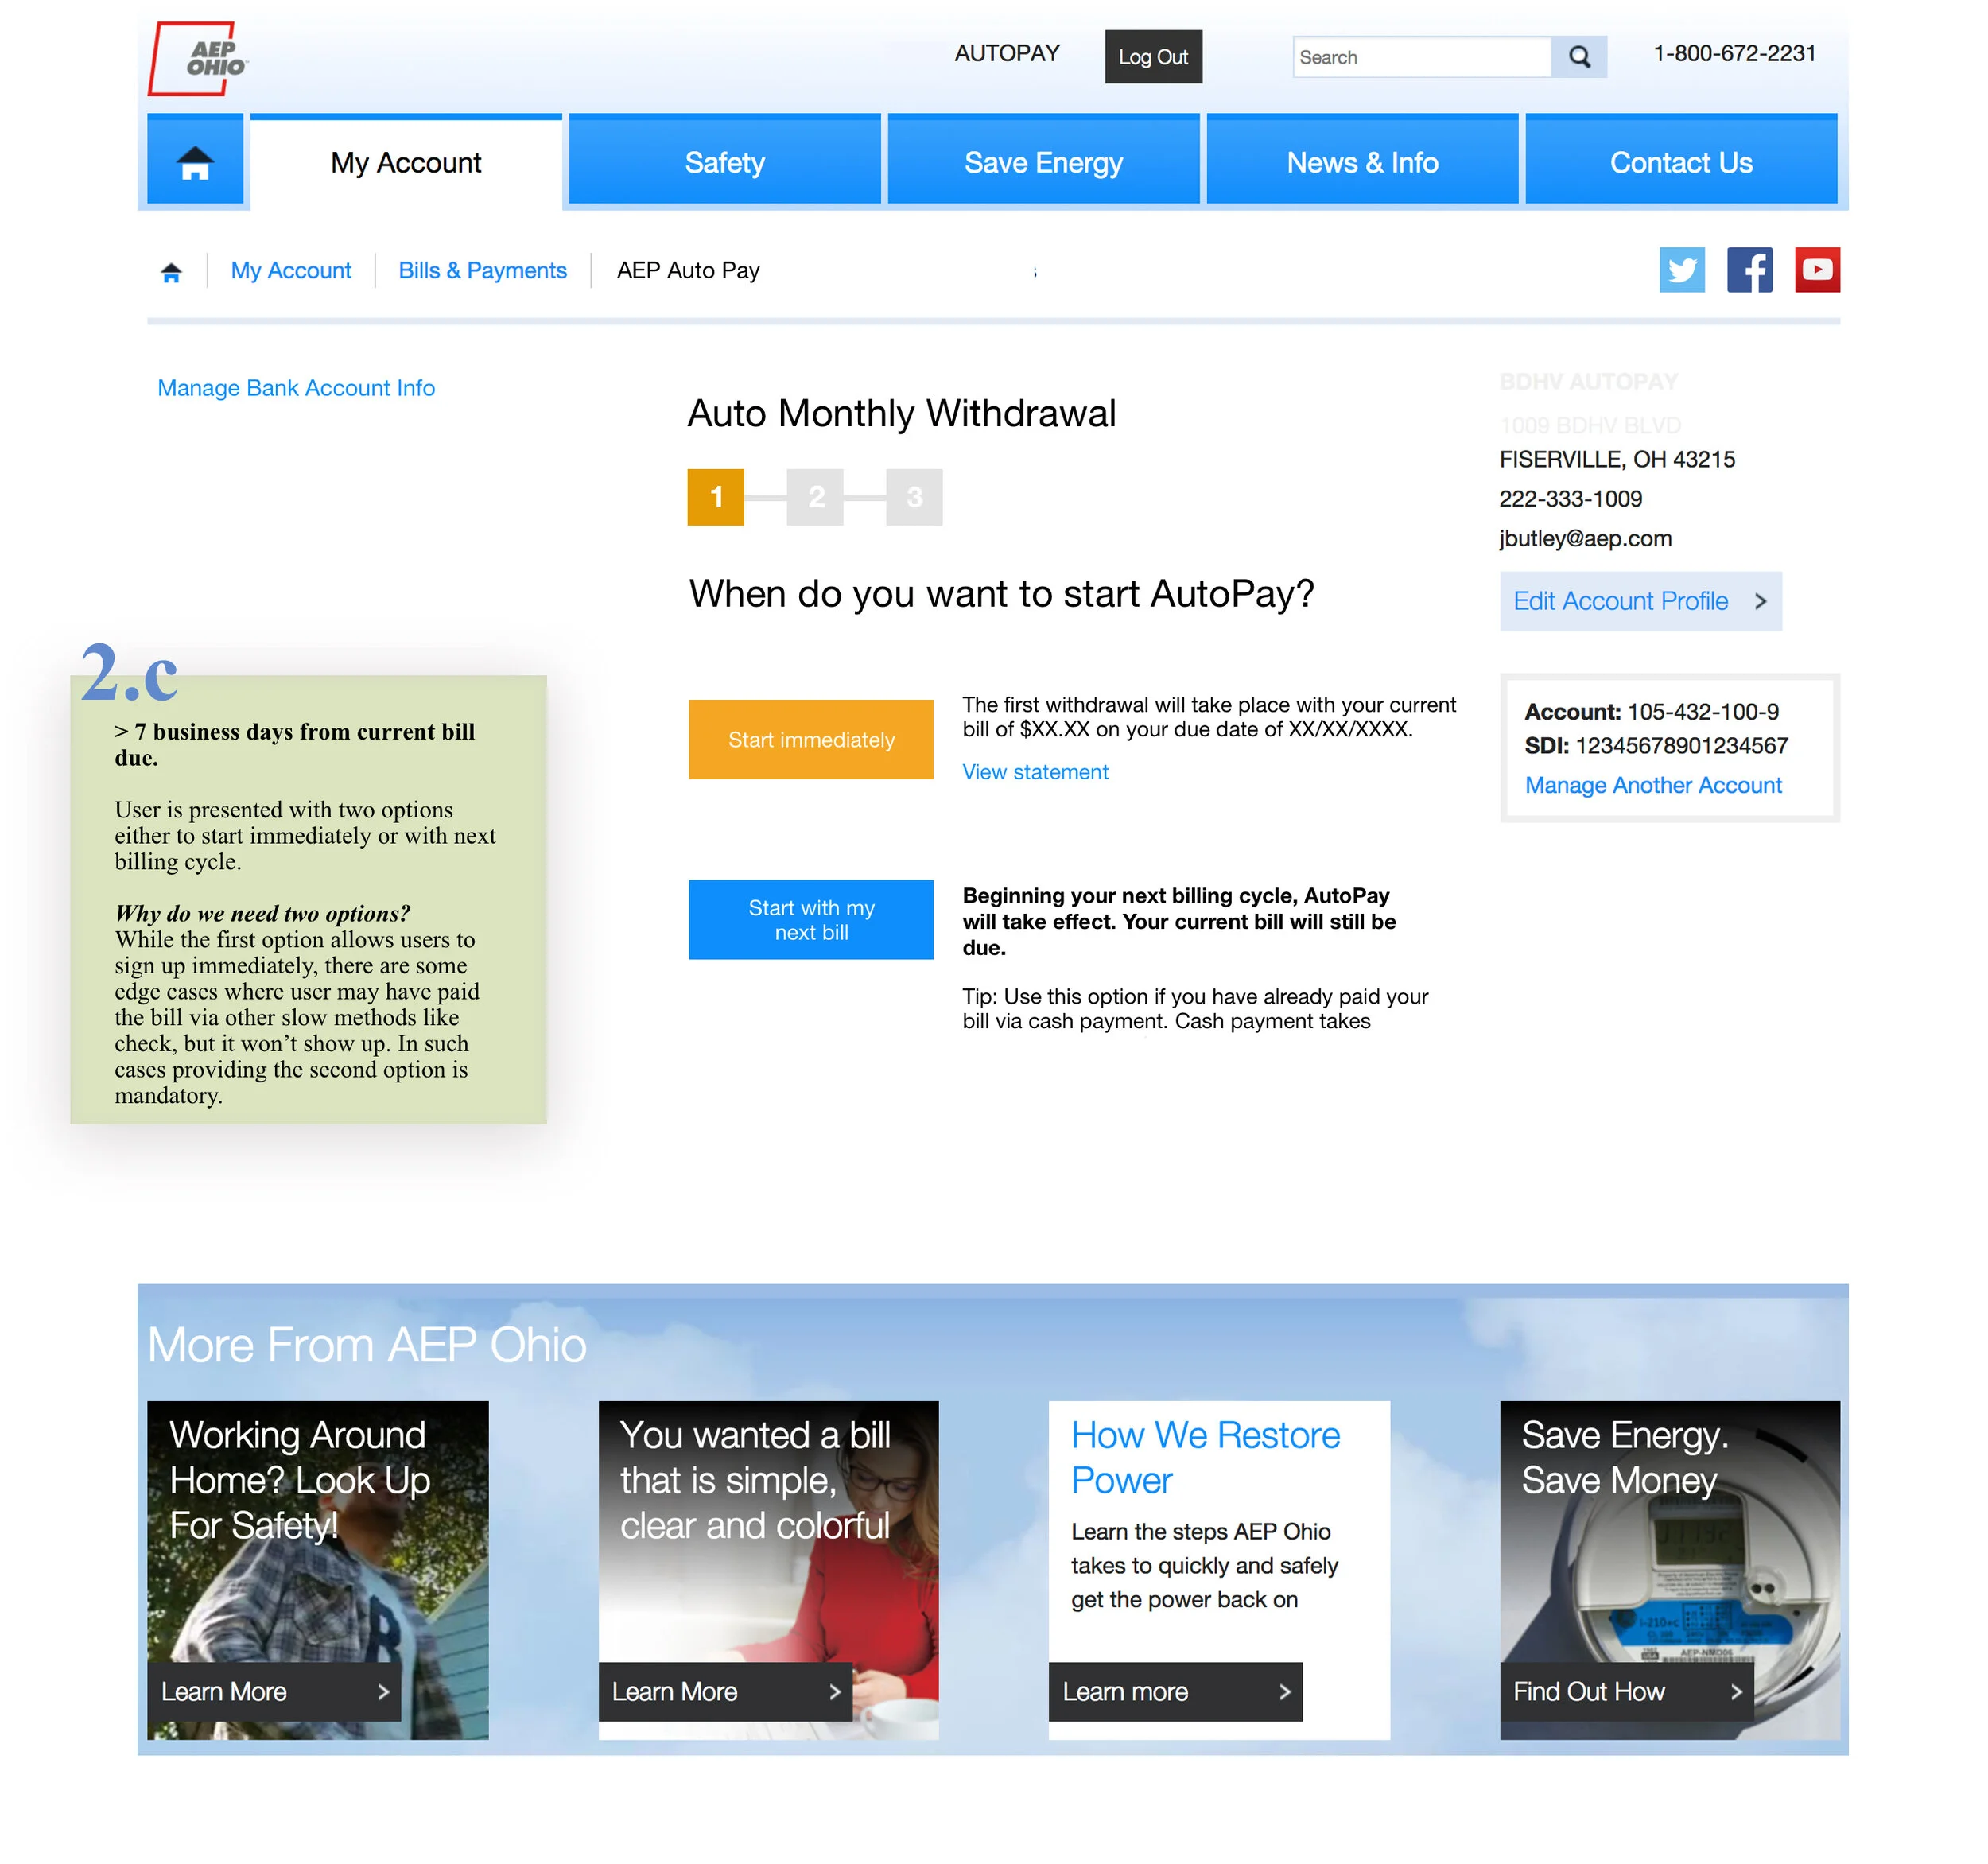
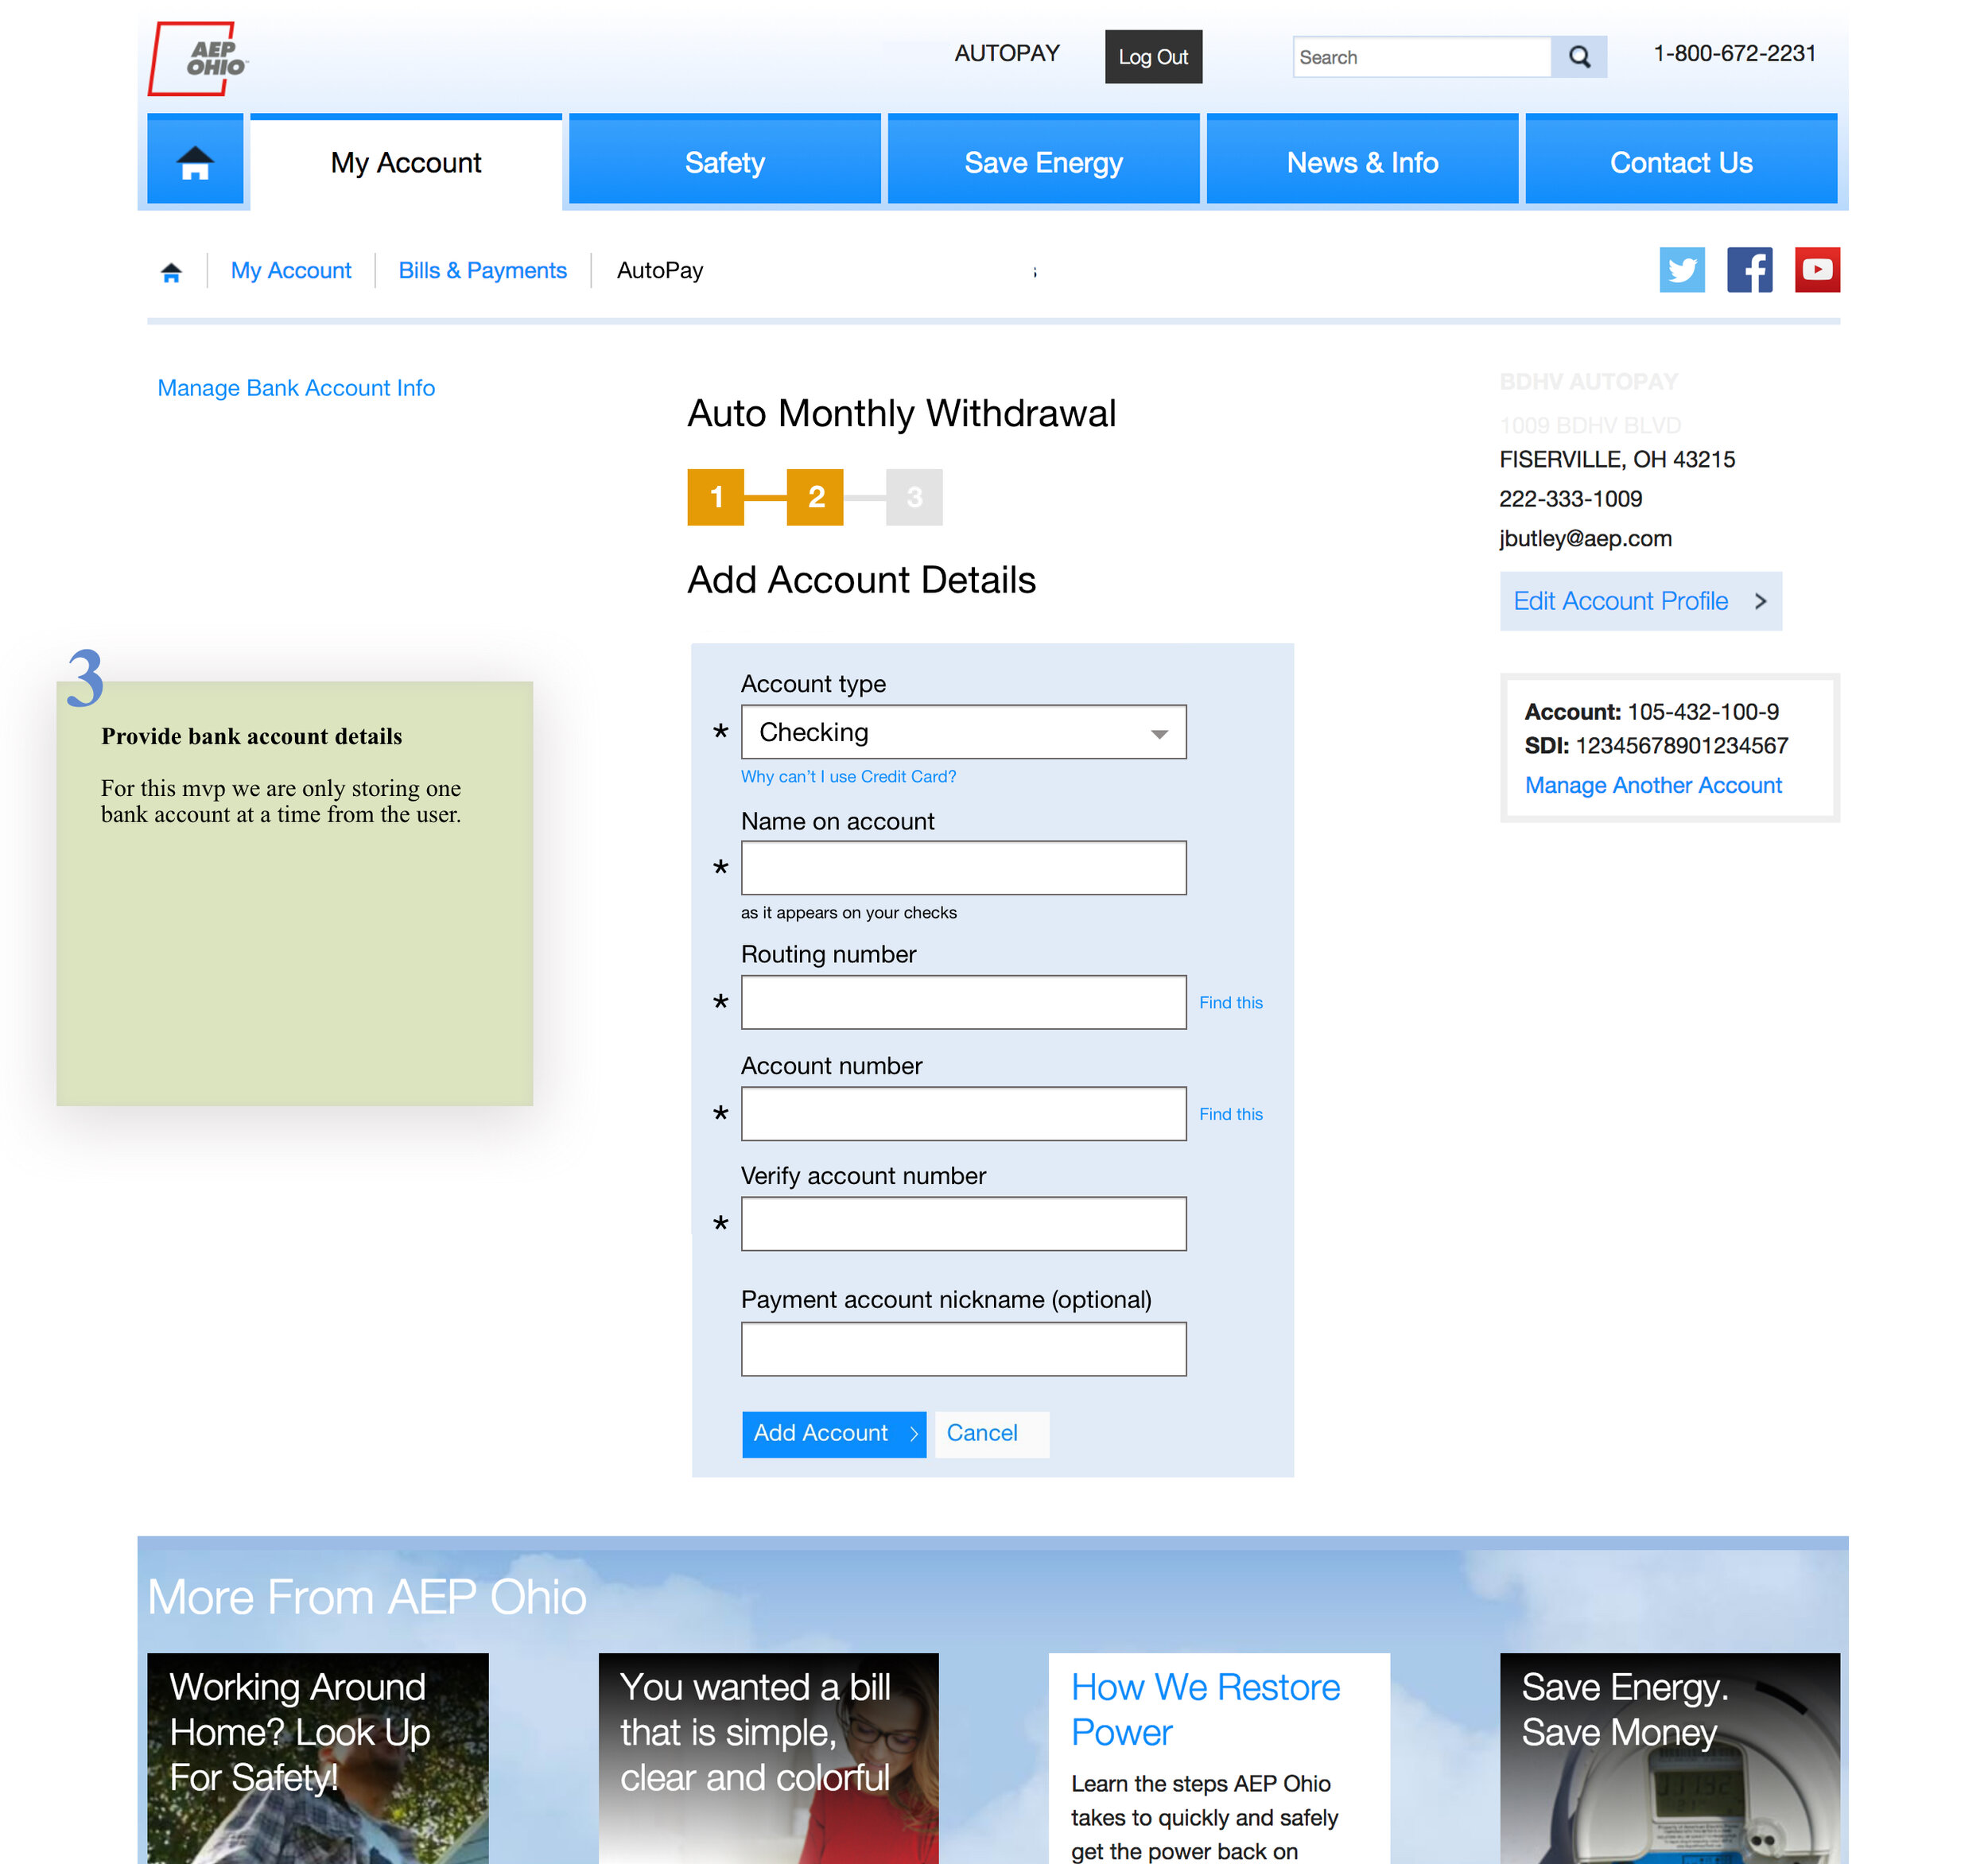
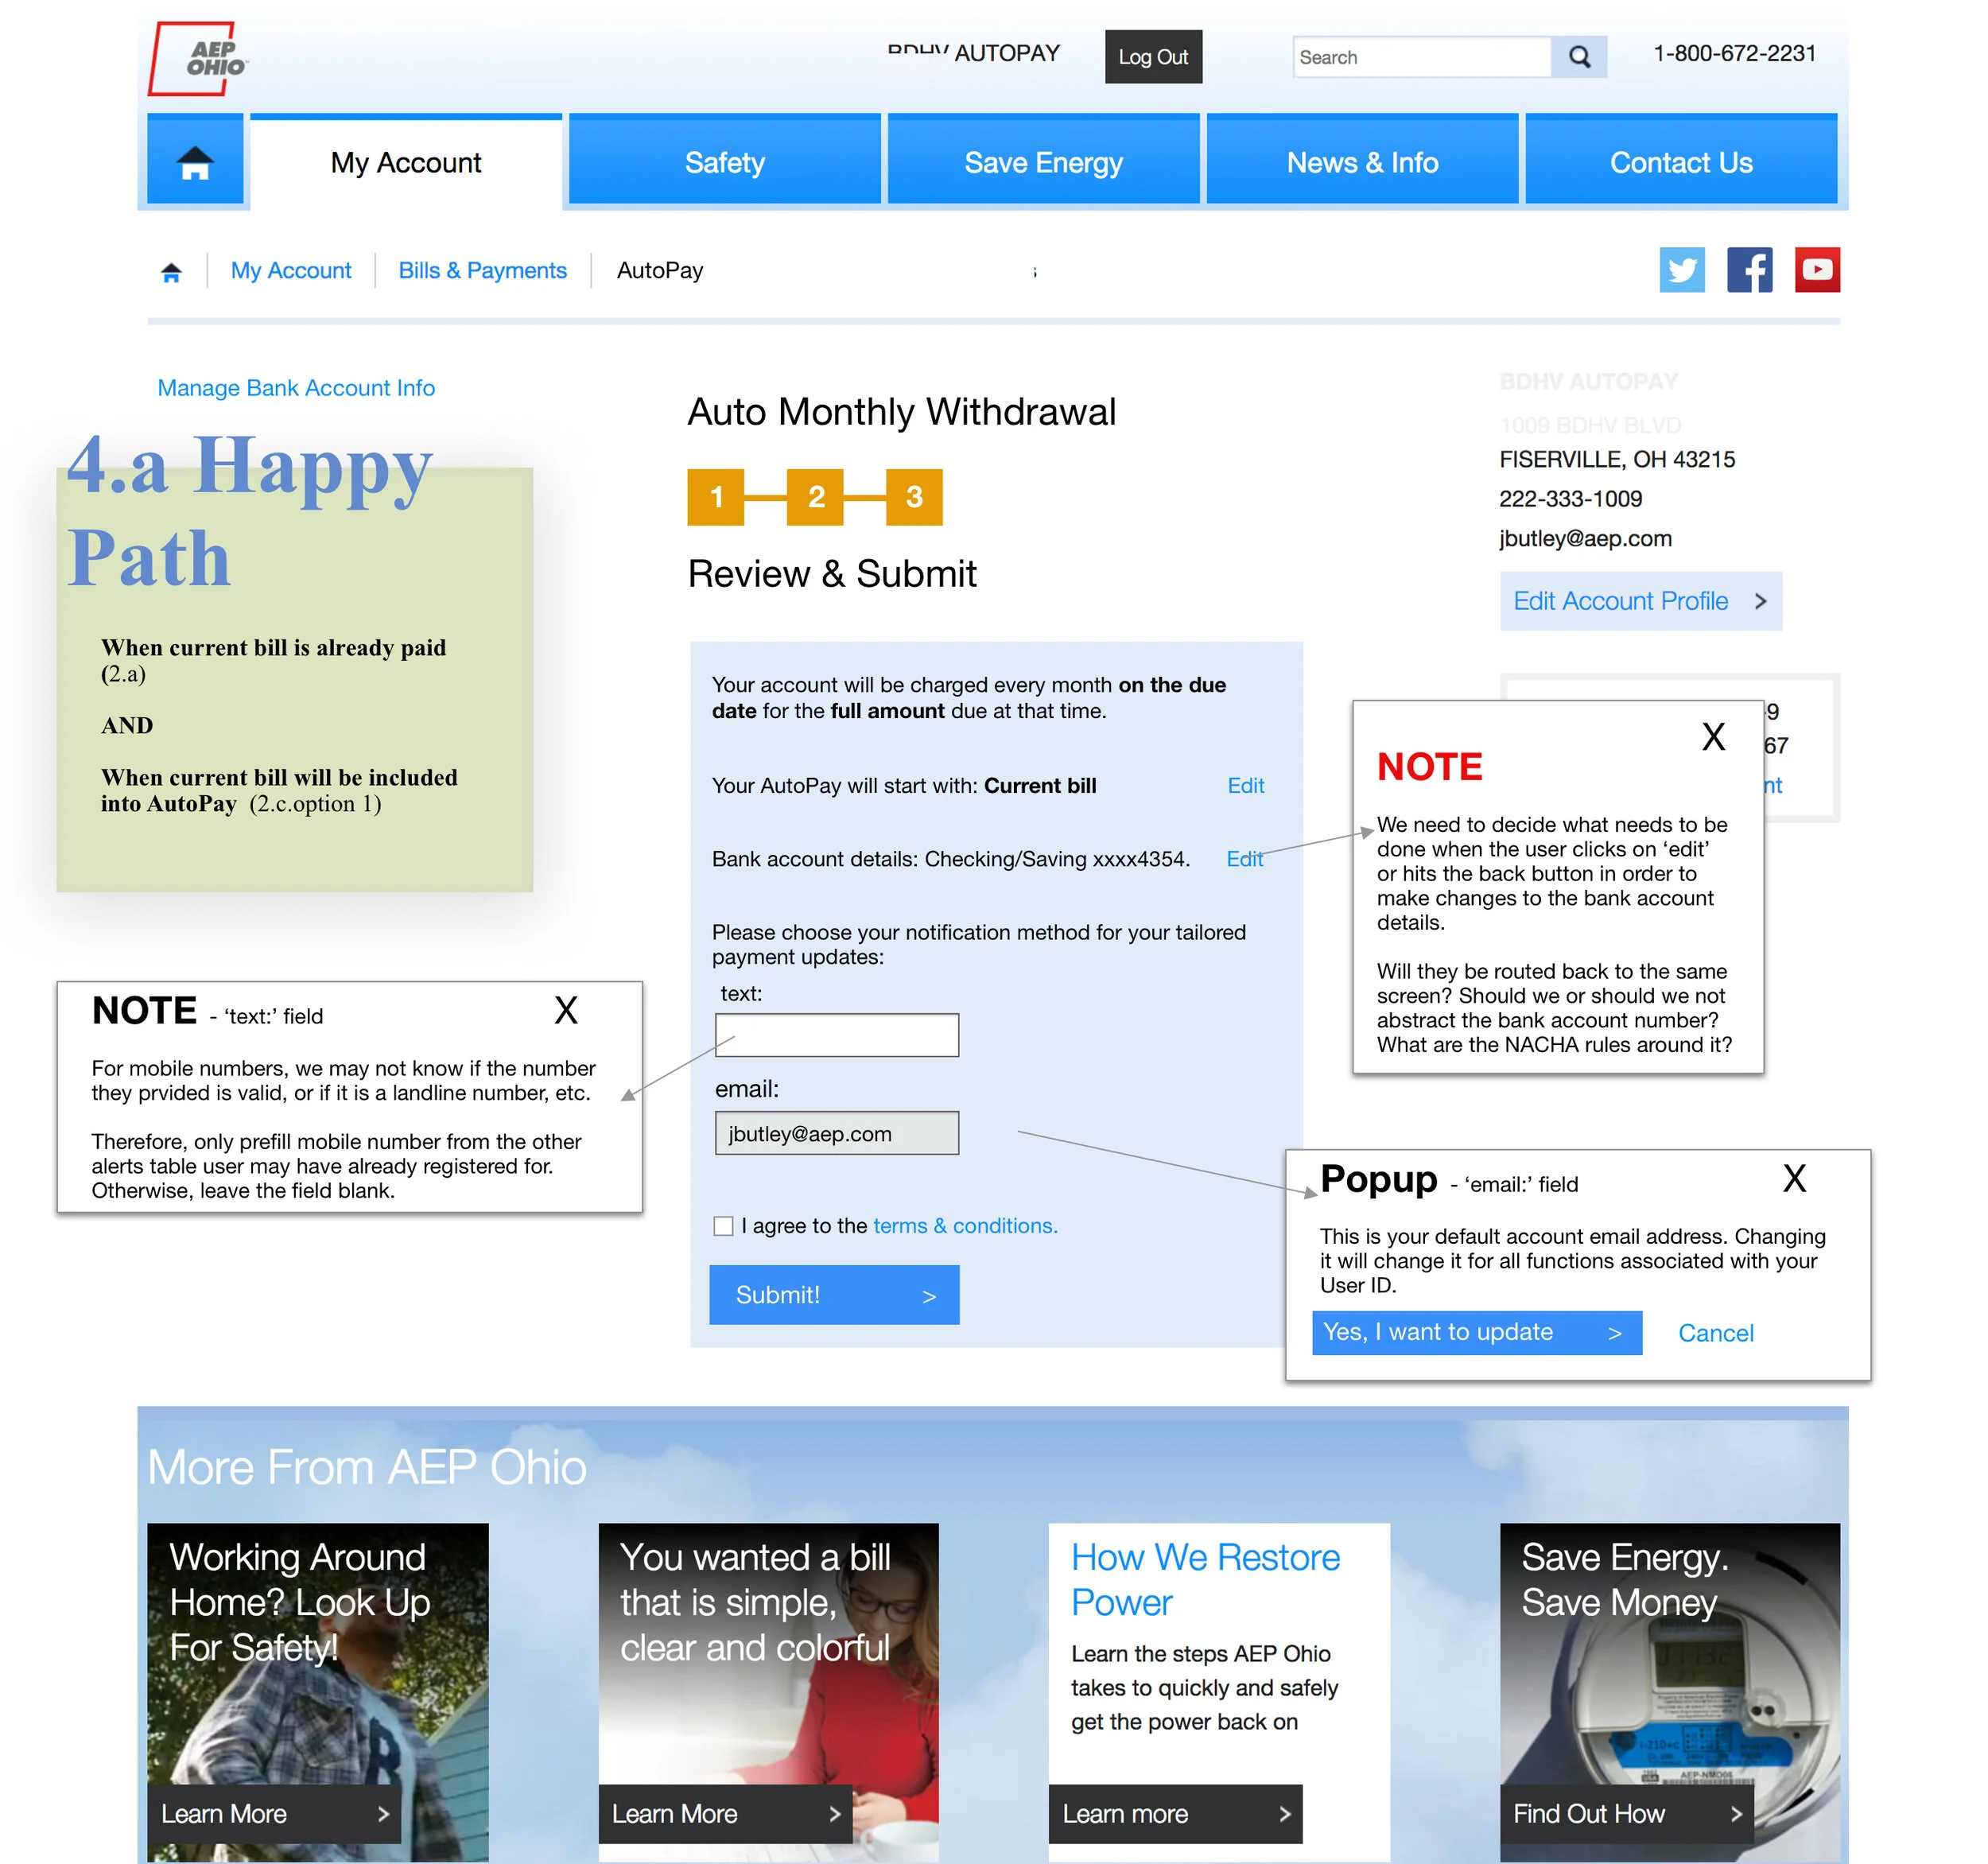
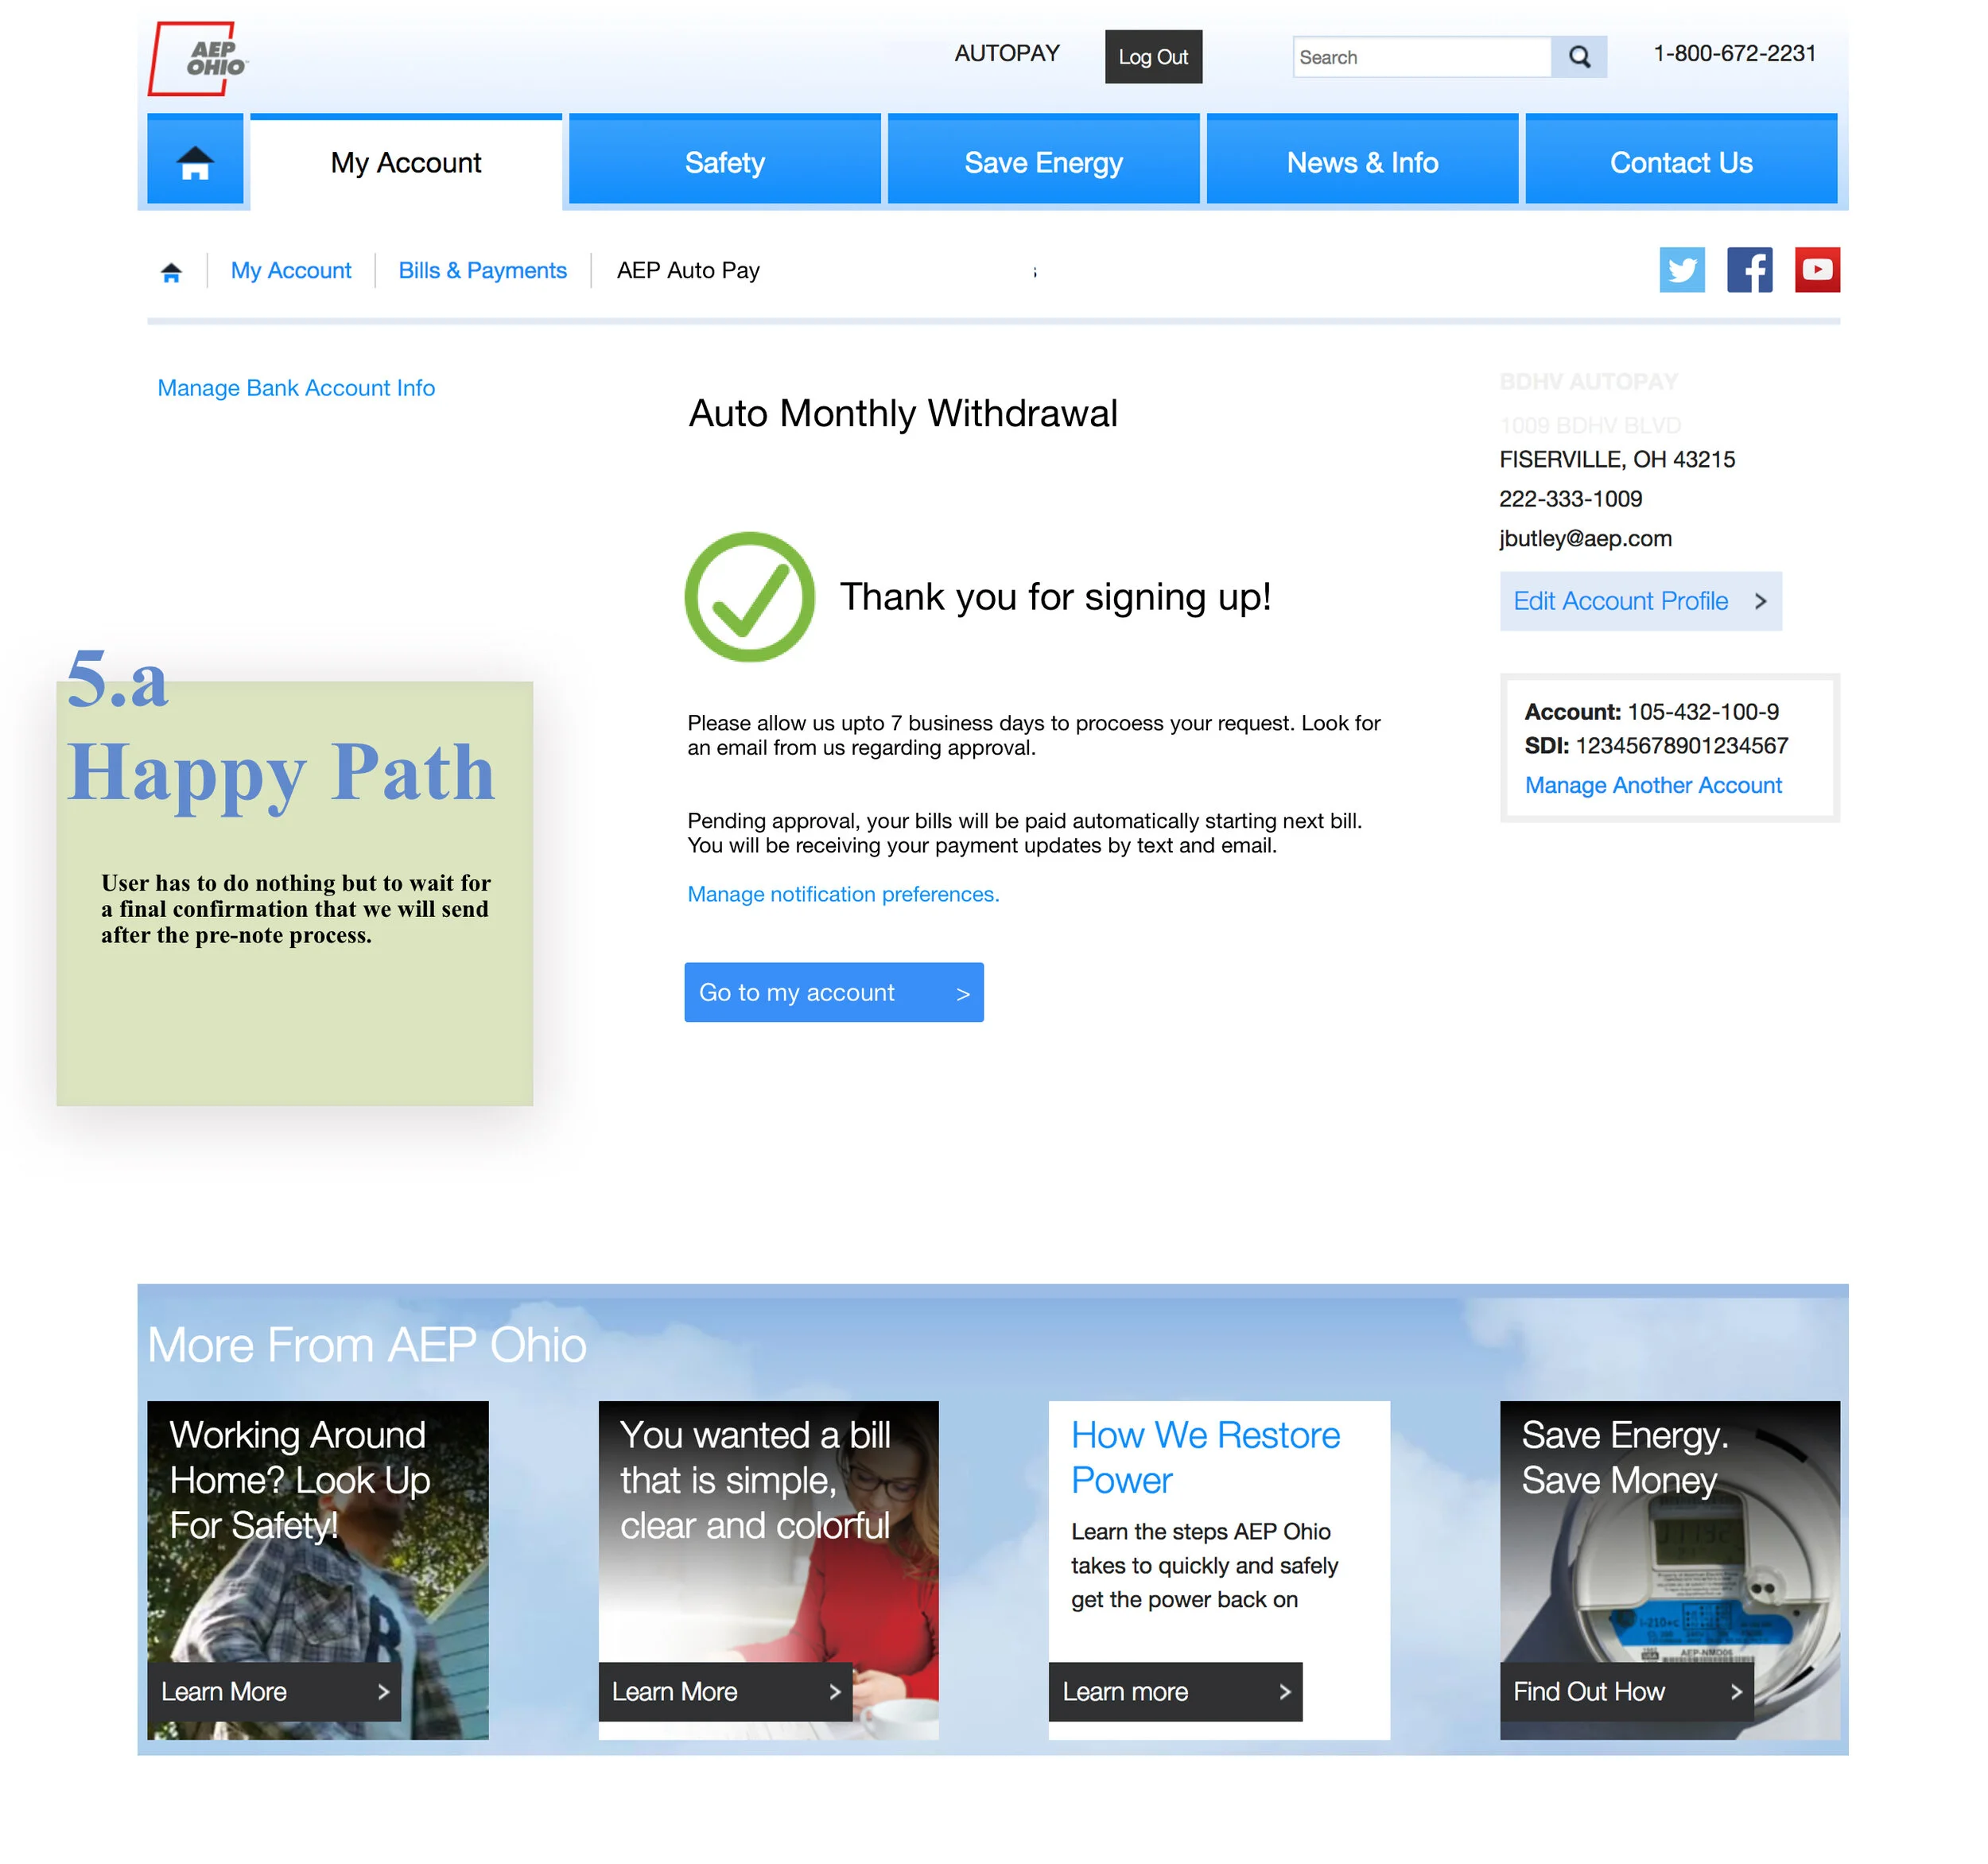
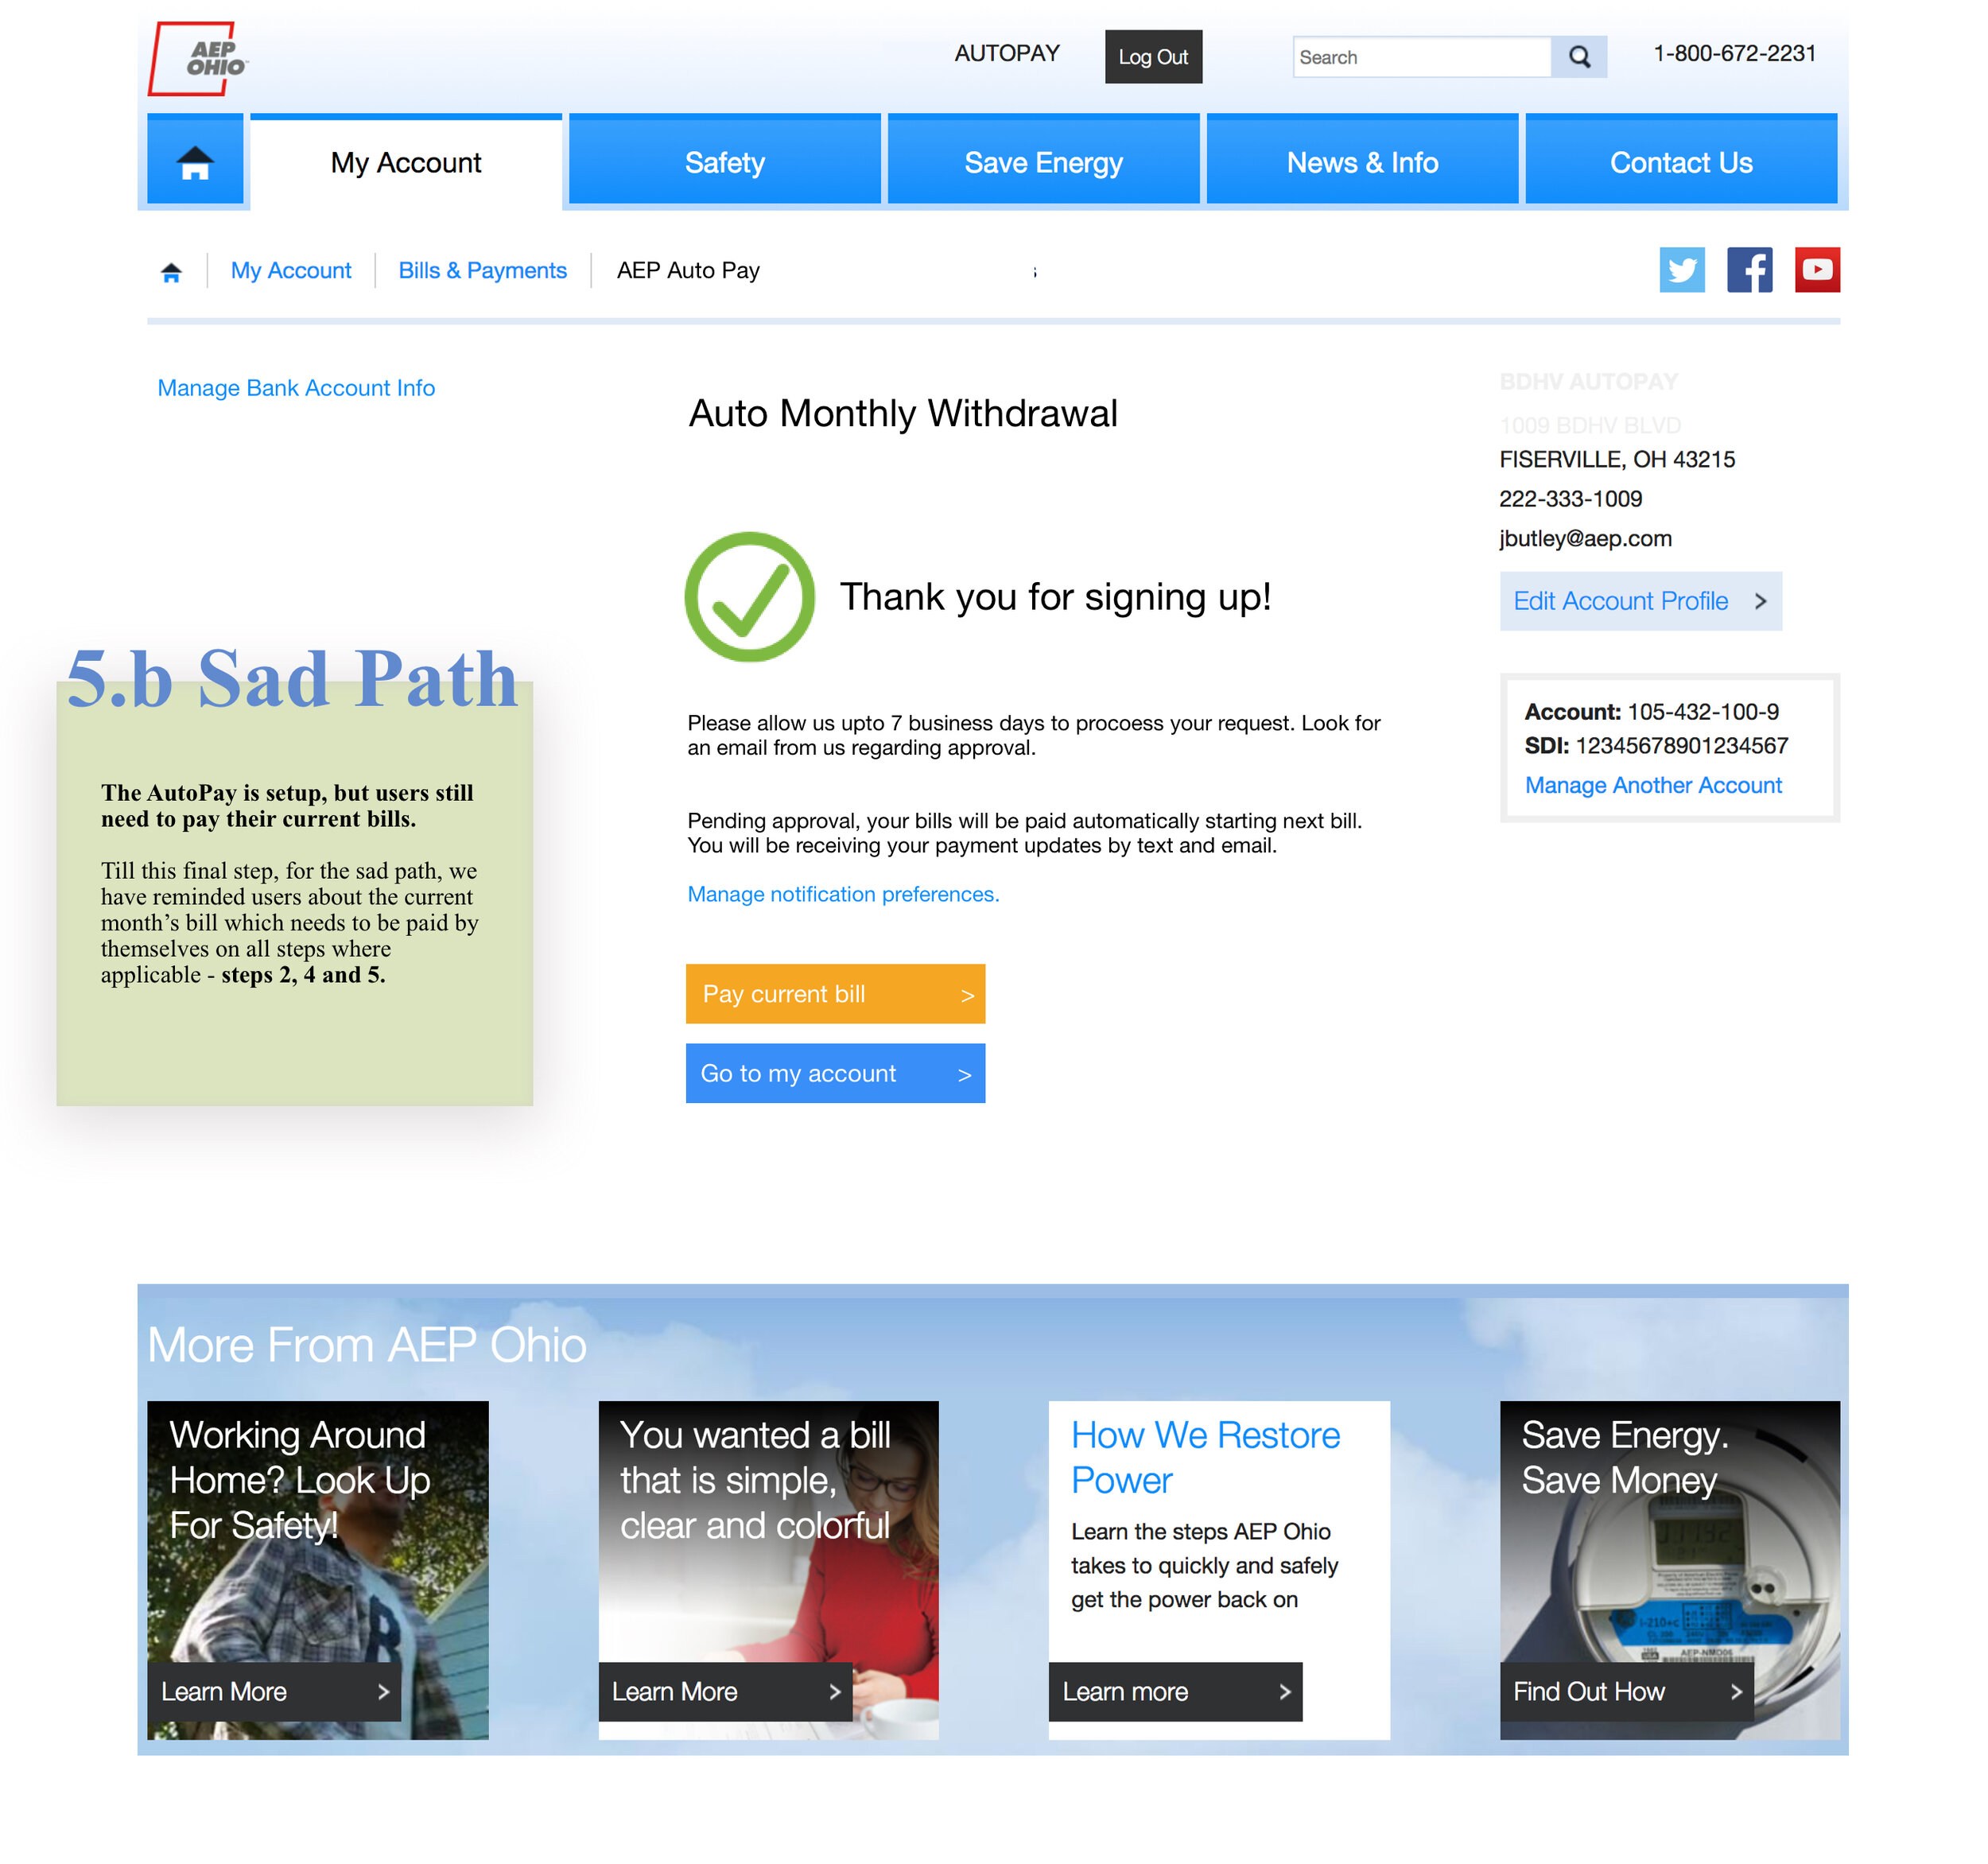
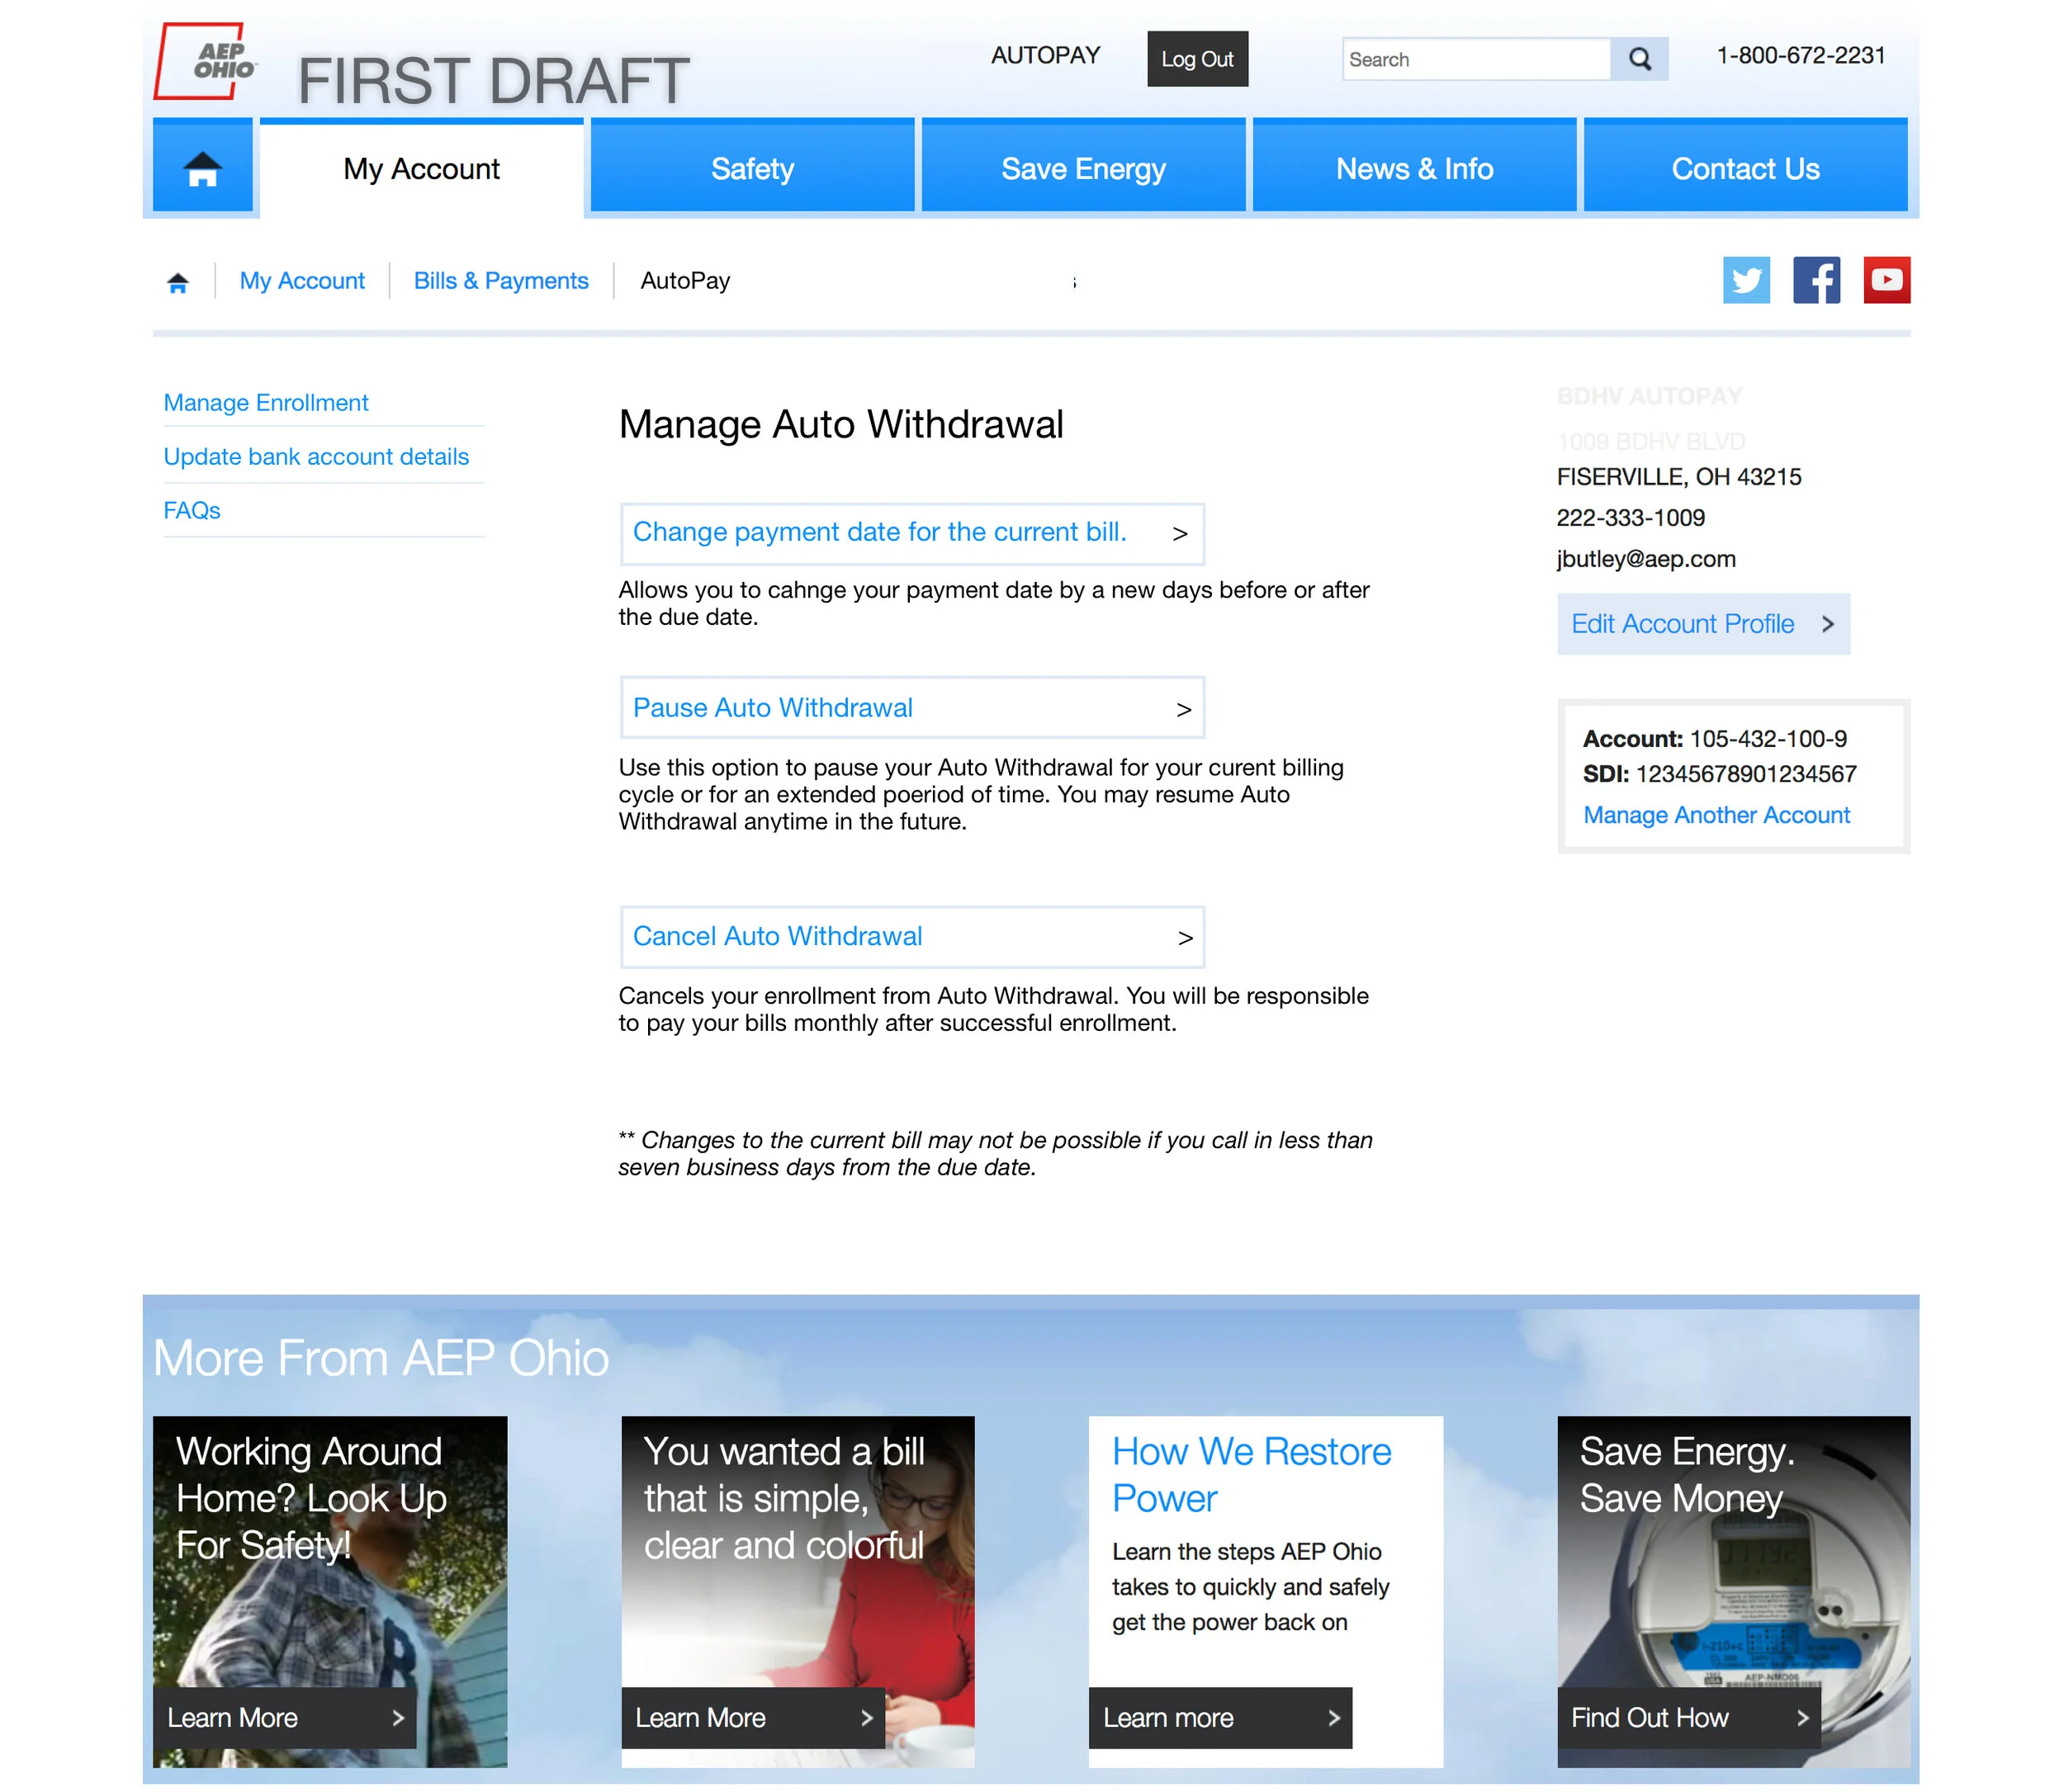
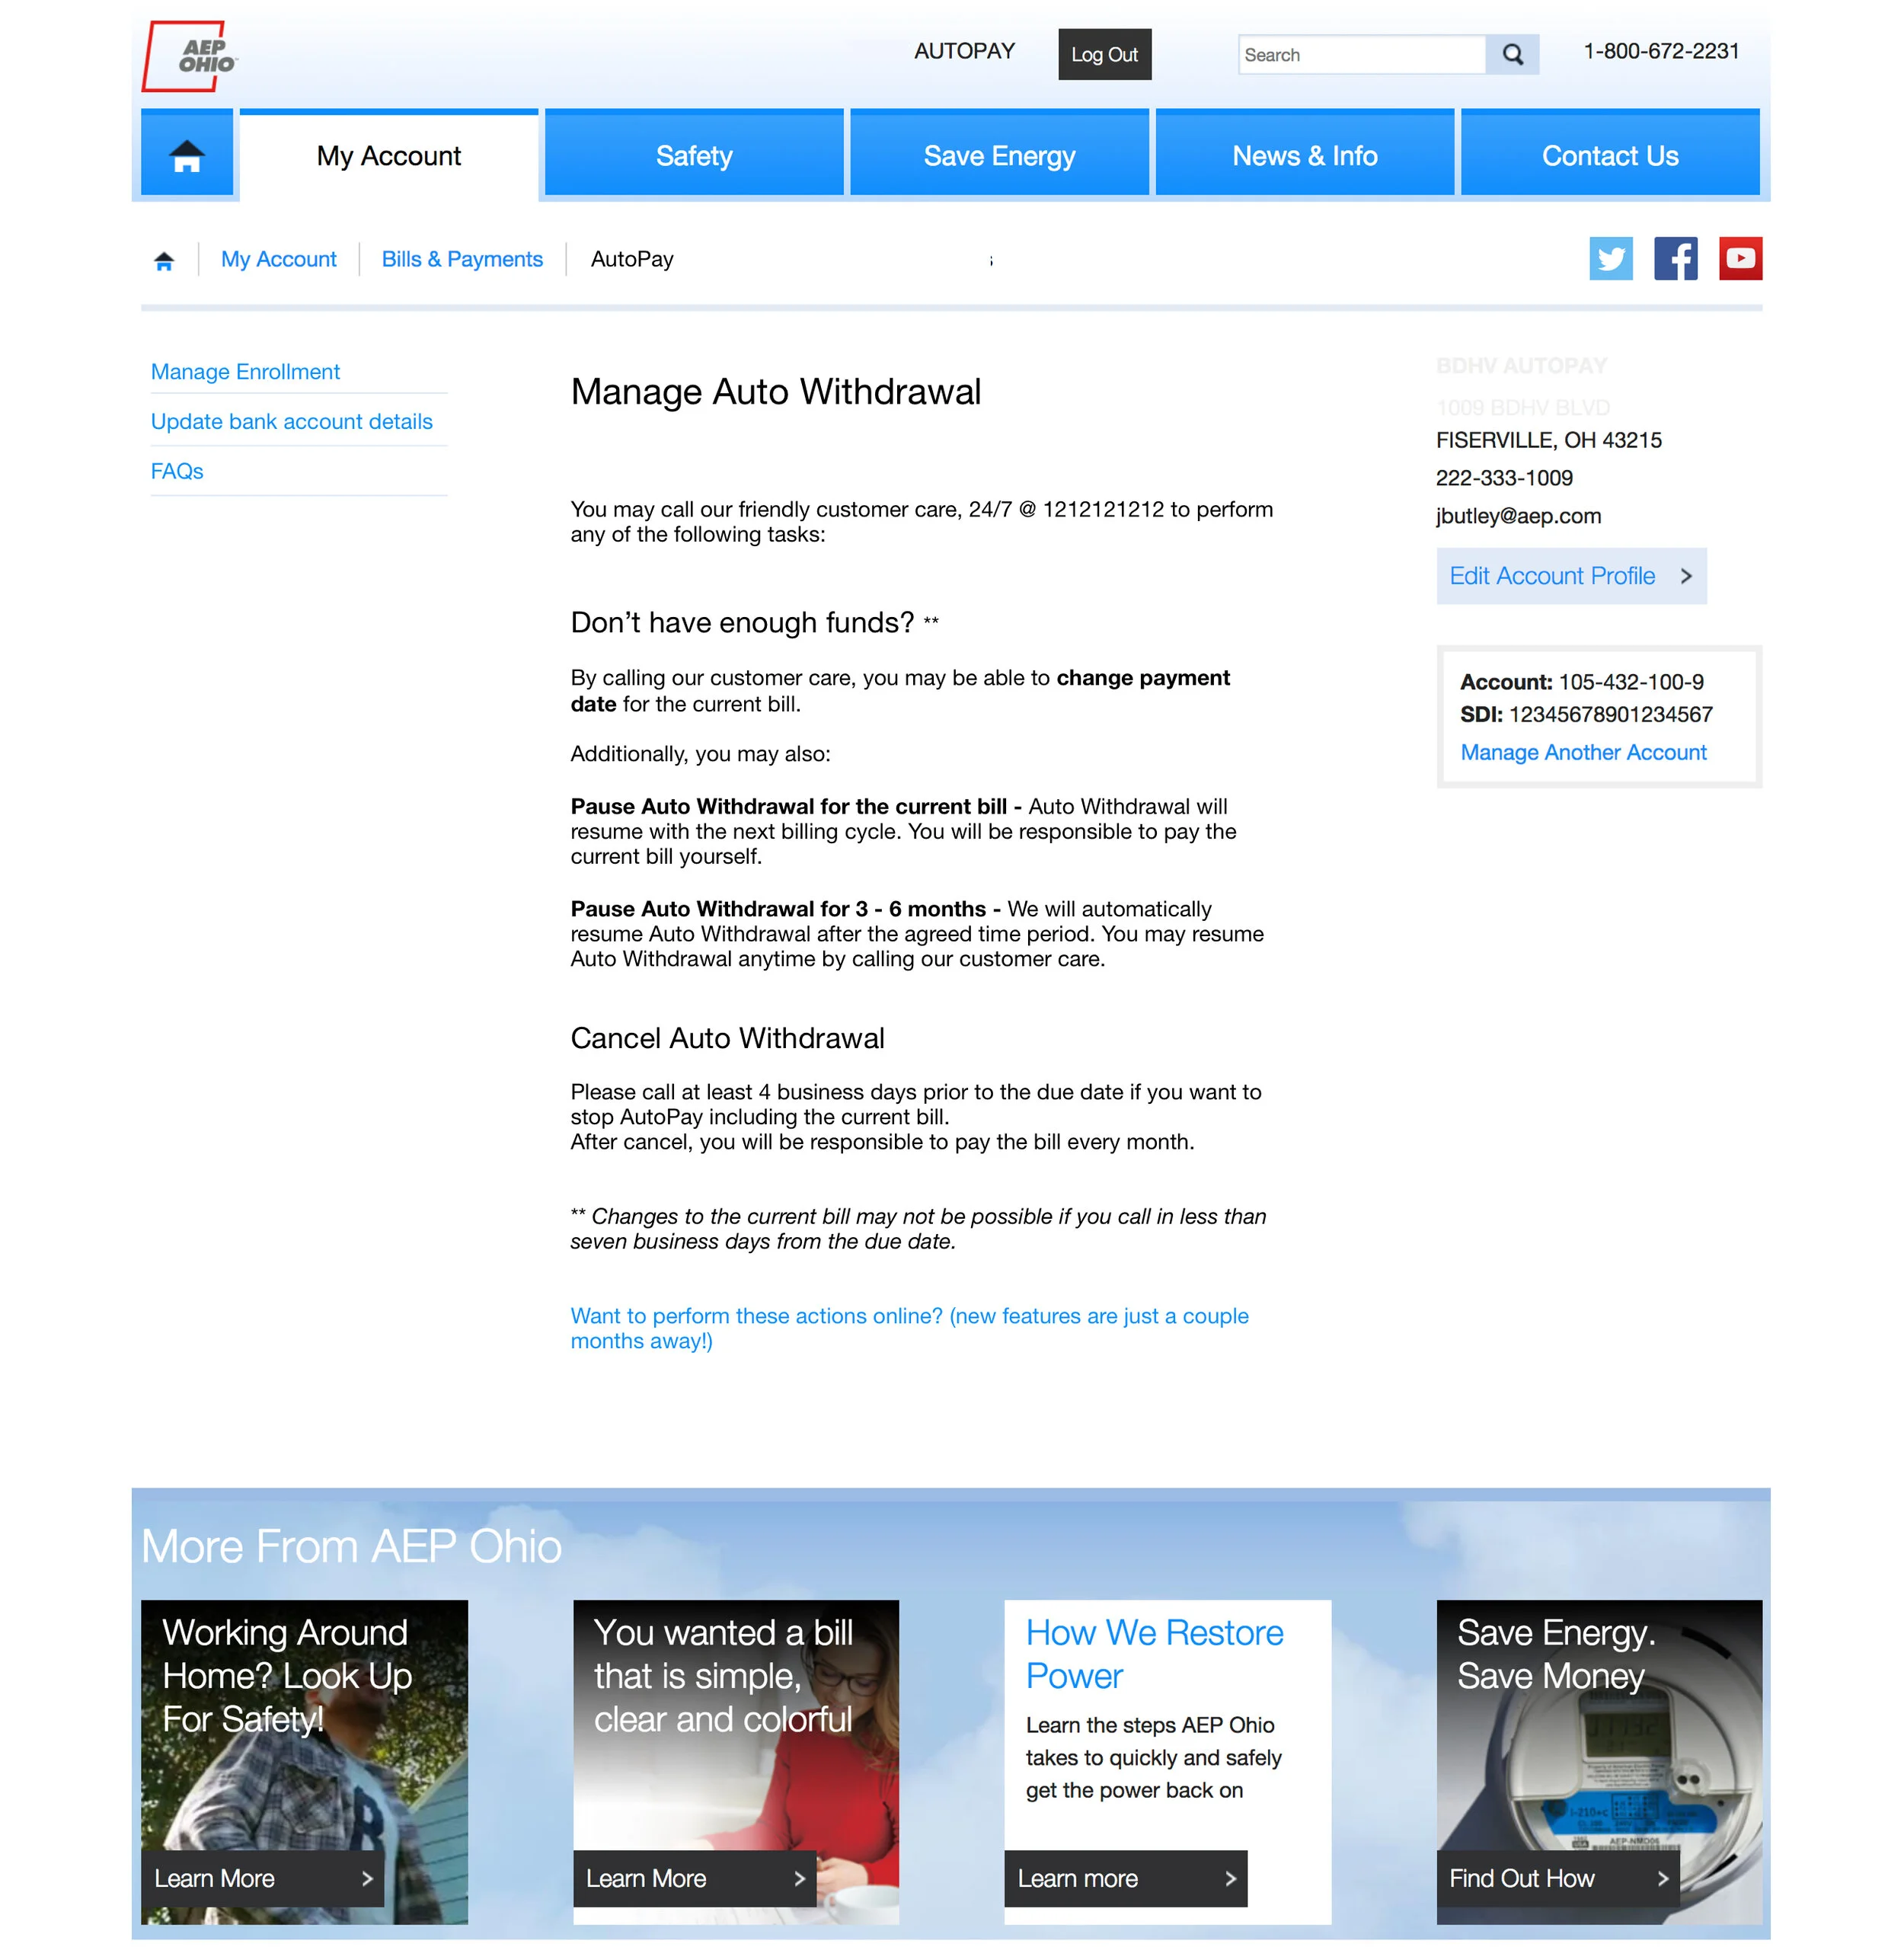
AEP - Automatic Bill Payment System
Scope: User Research, Stakeholder Alignment. UX Design, UI Design, Deployed. | Status: Deployed
Problem Space: AEP decided to move away from a third-party vendor and build its own software for automatic bill payments.
Duration: 12 weeks | 2018
As the lead designer on the project, I worked with the PO, team, and several other internal stakeholders to define the product's UX strategy and design a product that met both users’ needs while also aligning with stakeholder expectations.
Challenges - Users:
The existing auto-pay had gained a less favorable reputation among users due to its complexity, slow activation time, and communication shortcomings.
Users had concerns about situations like bounced payments or whether a payment went through on time.
The existing auto-pay took a long time to get activated. Many avoided it because of that.
They felt that it was more difficult to manage auto-pay than it was to make monthly payments by themselves.
Stakeholders:
AEP offered several bill payment options alongside automatic payments, offering varying levels of cost and convenience to the user.
These payment options were managed separately by different teams, and the teams often competed for web presence and resources.
Need for all the teams to align to a common vision, so that the new auto-pay feature serves everyone’s best interests.

Vertiv - Data Catalog
Scope: Product Roadmap & Strategy, Competitive Analysis, User Research, UI/UX Revisions. | Status: Unknown
Problem Space: Vertiv began building an ambitious data catalog for its global data teams, which it also intended to sell commercially. We were brought in midway as UX consultants after they realized they needed to take a few steps back and determine a product vision and a design direction.
Duration - 7 weeks | 2021
Competitive analysis
We studied a few other data catalog product offerings that are already on the market. We did a competitive analysis and shared those insights with our client to help them evaluate the product features they have built thus far.
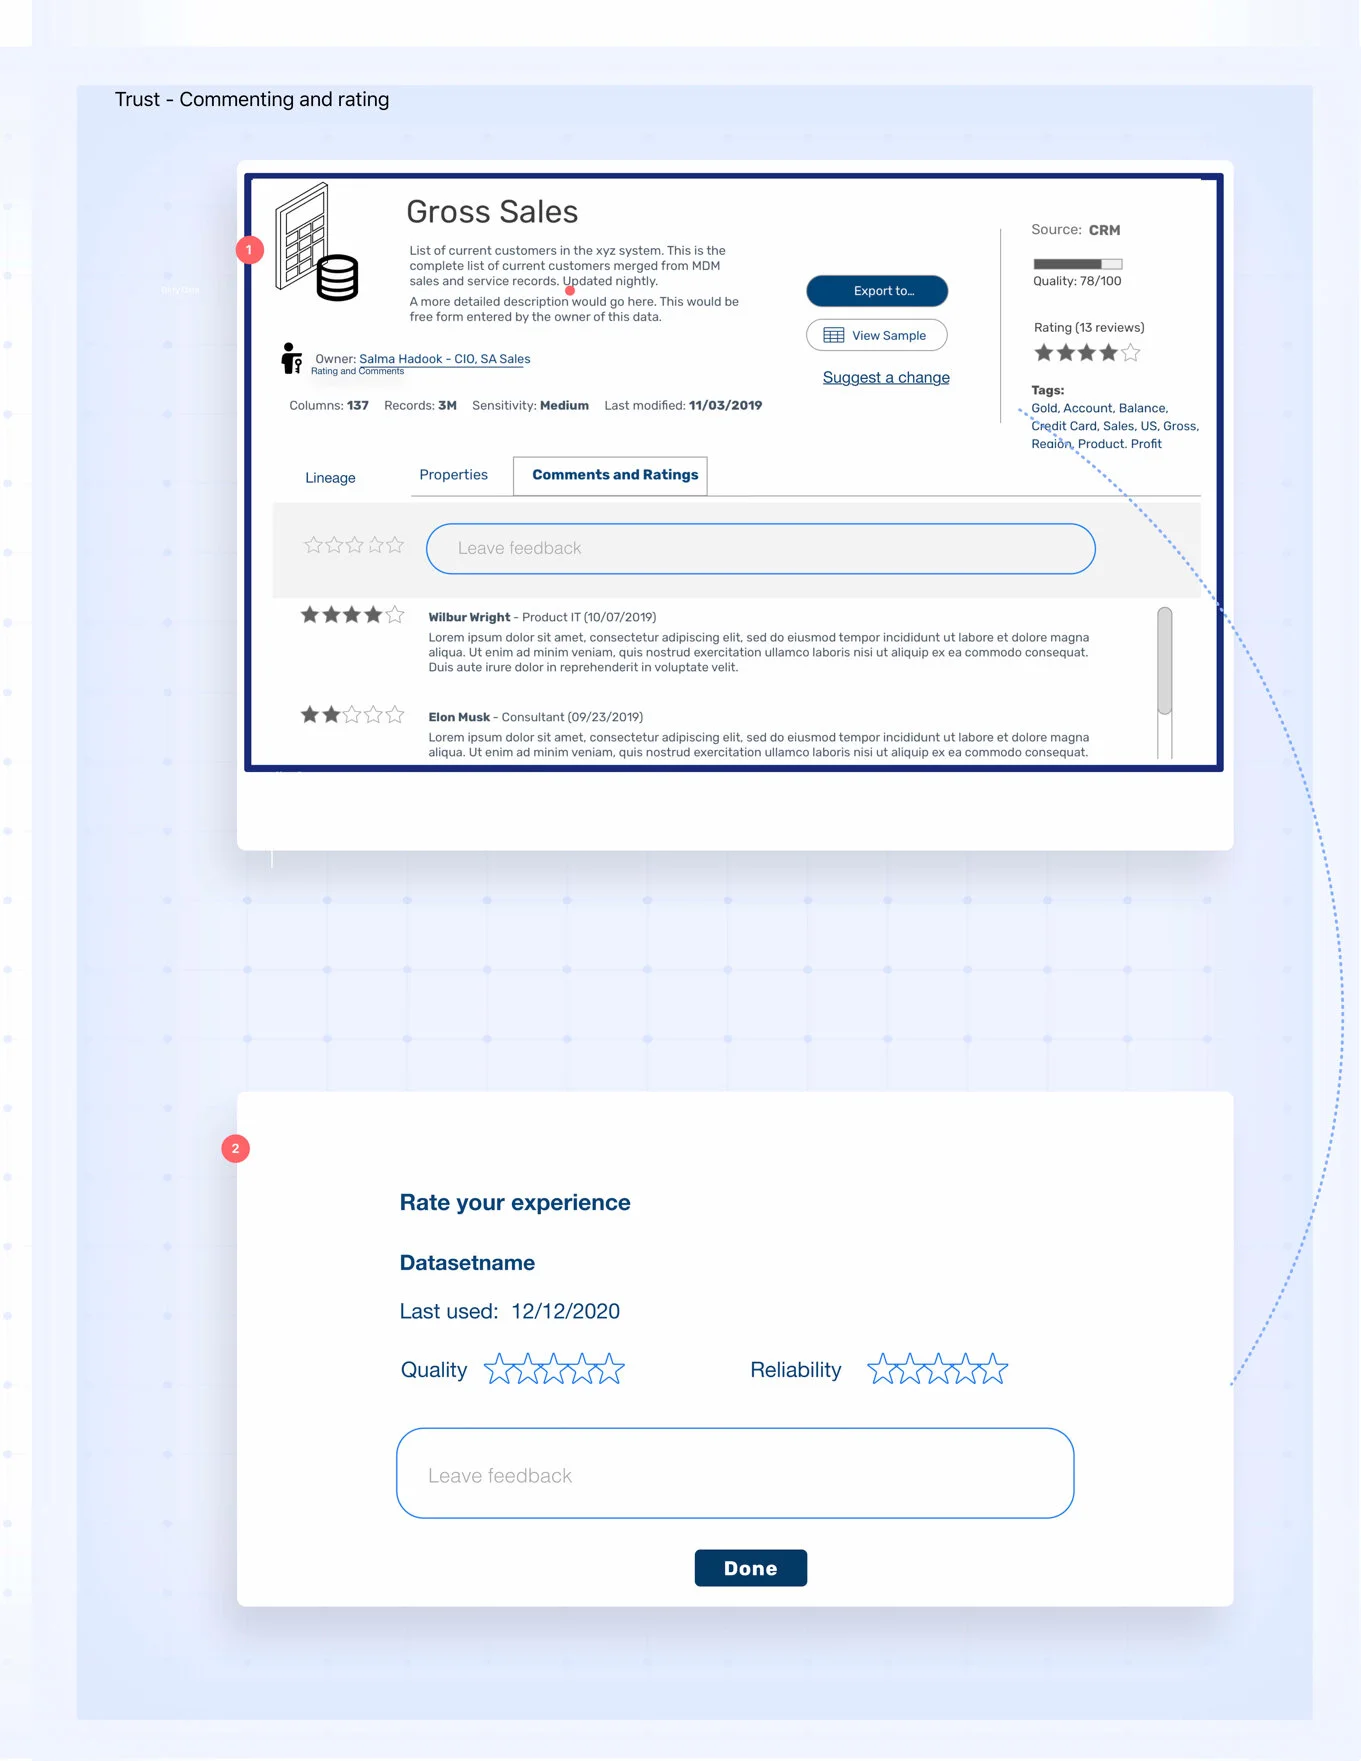
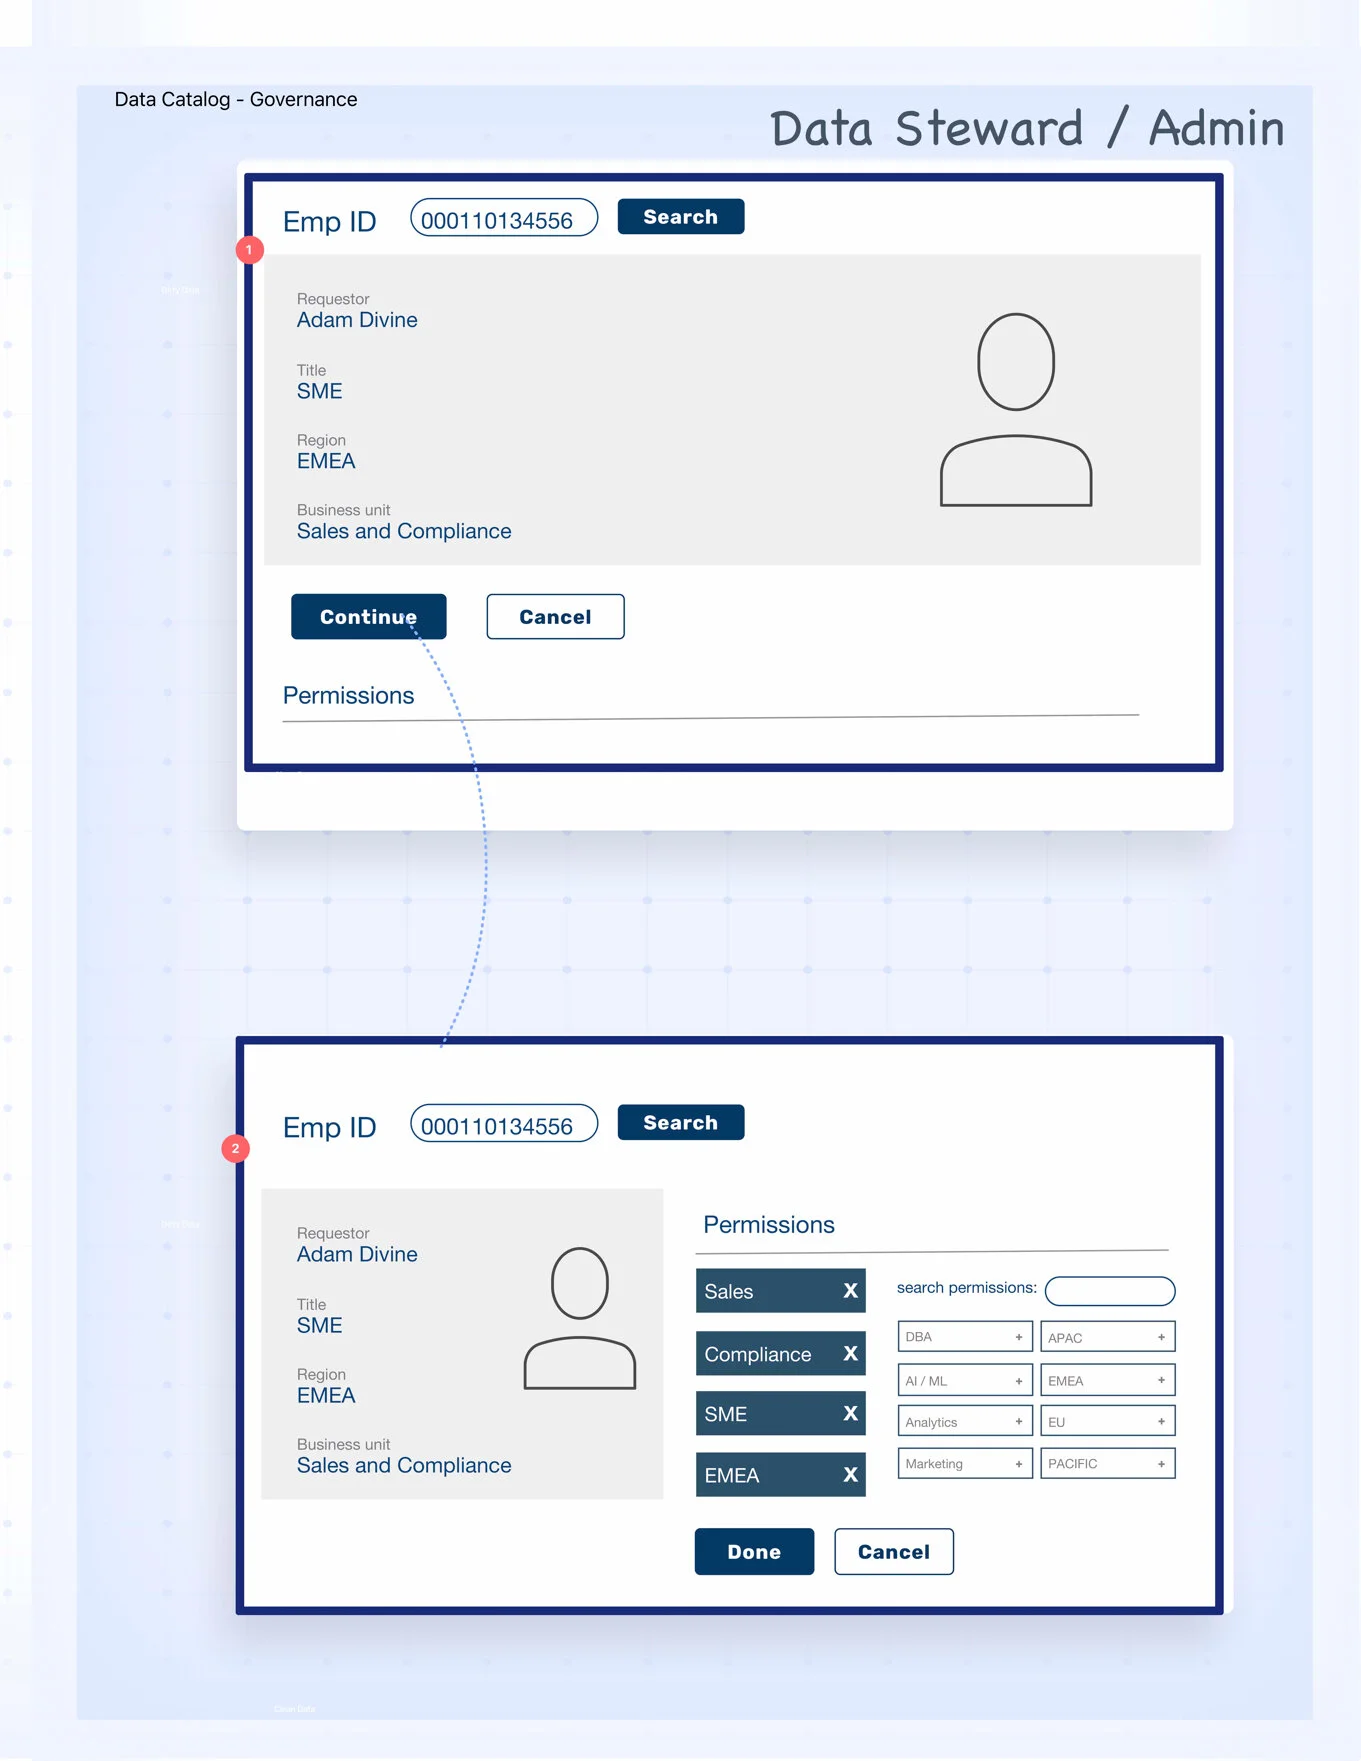
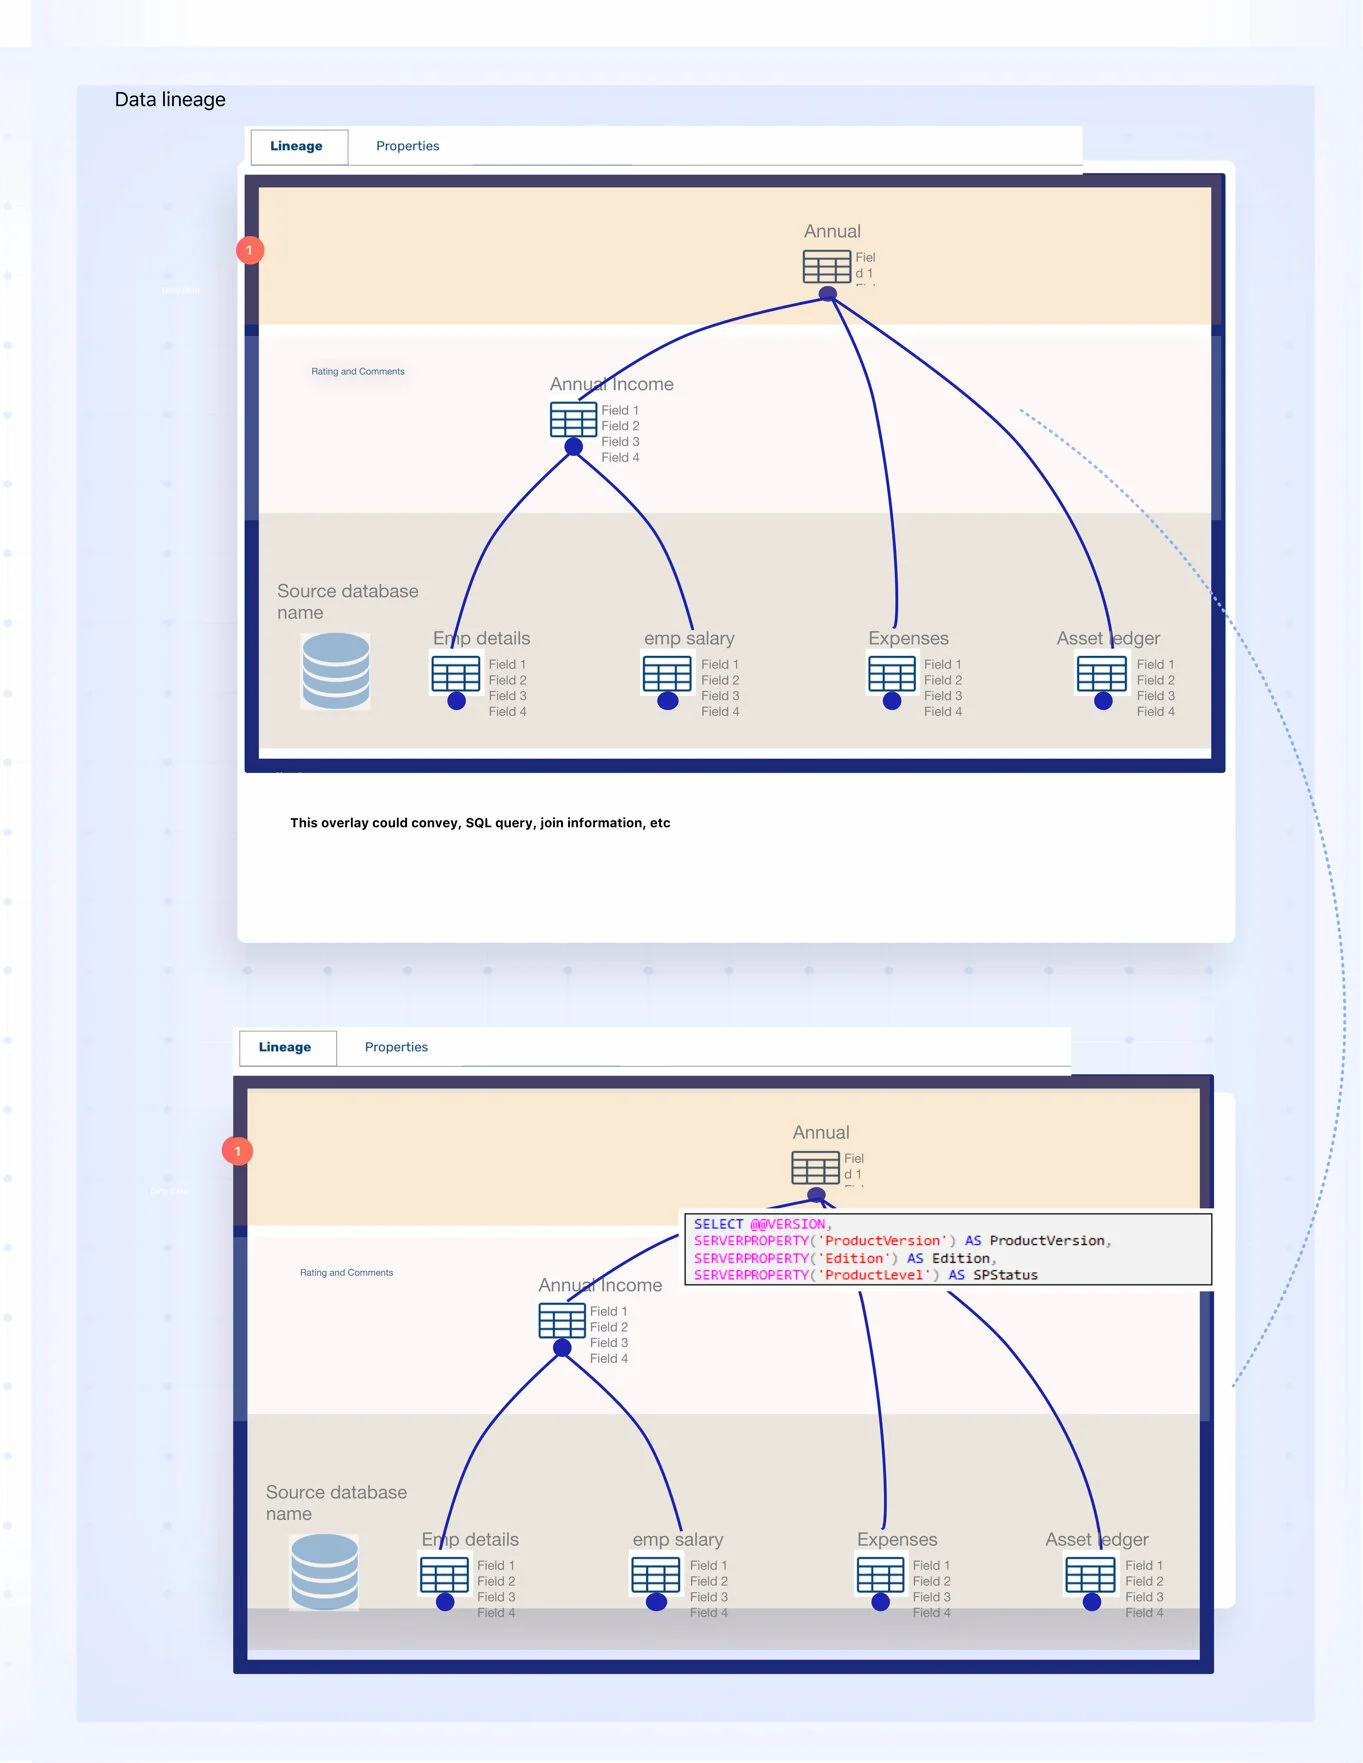
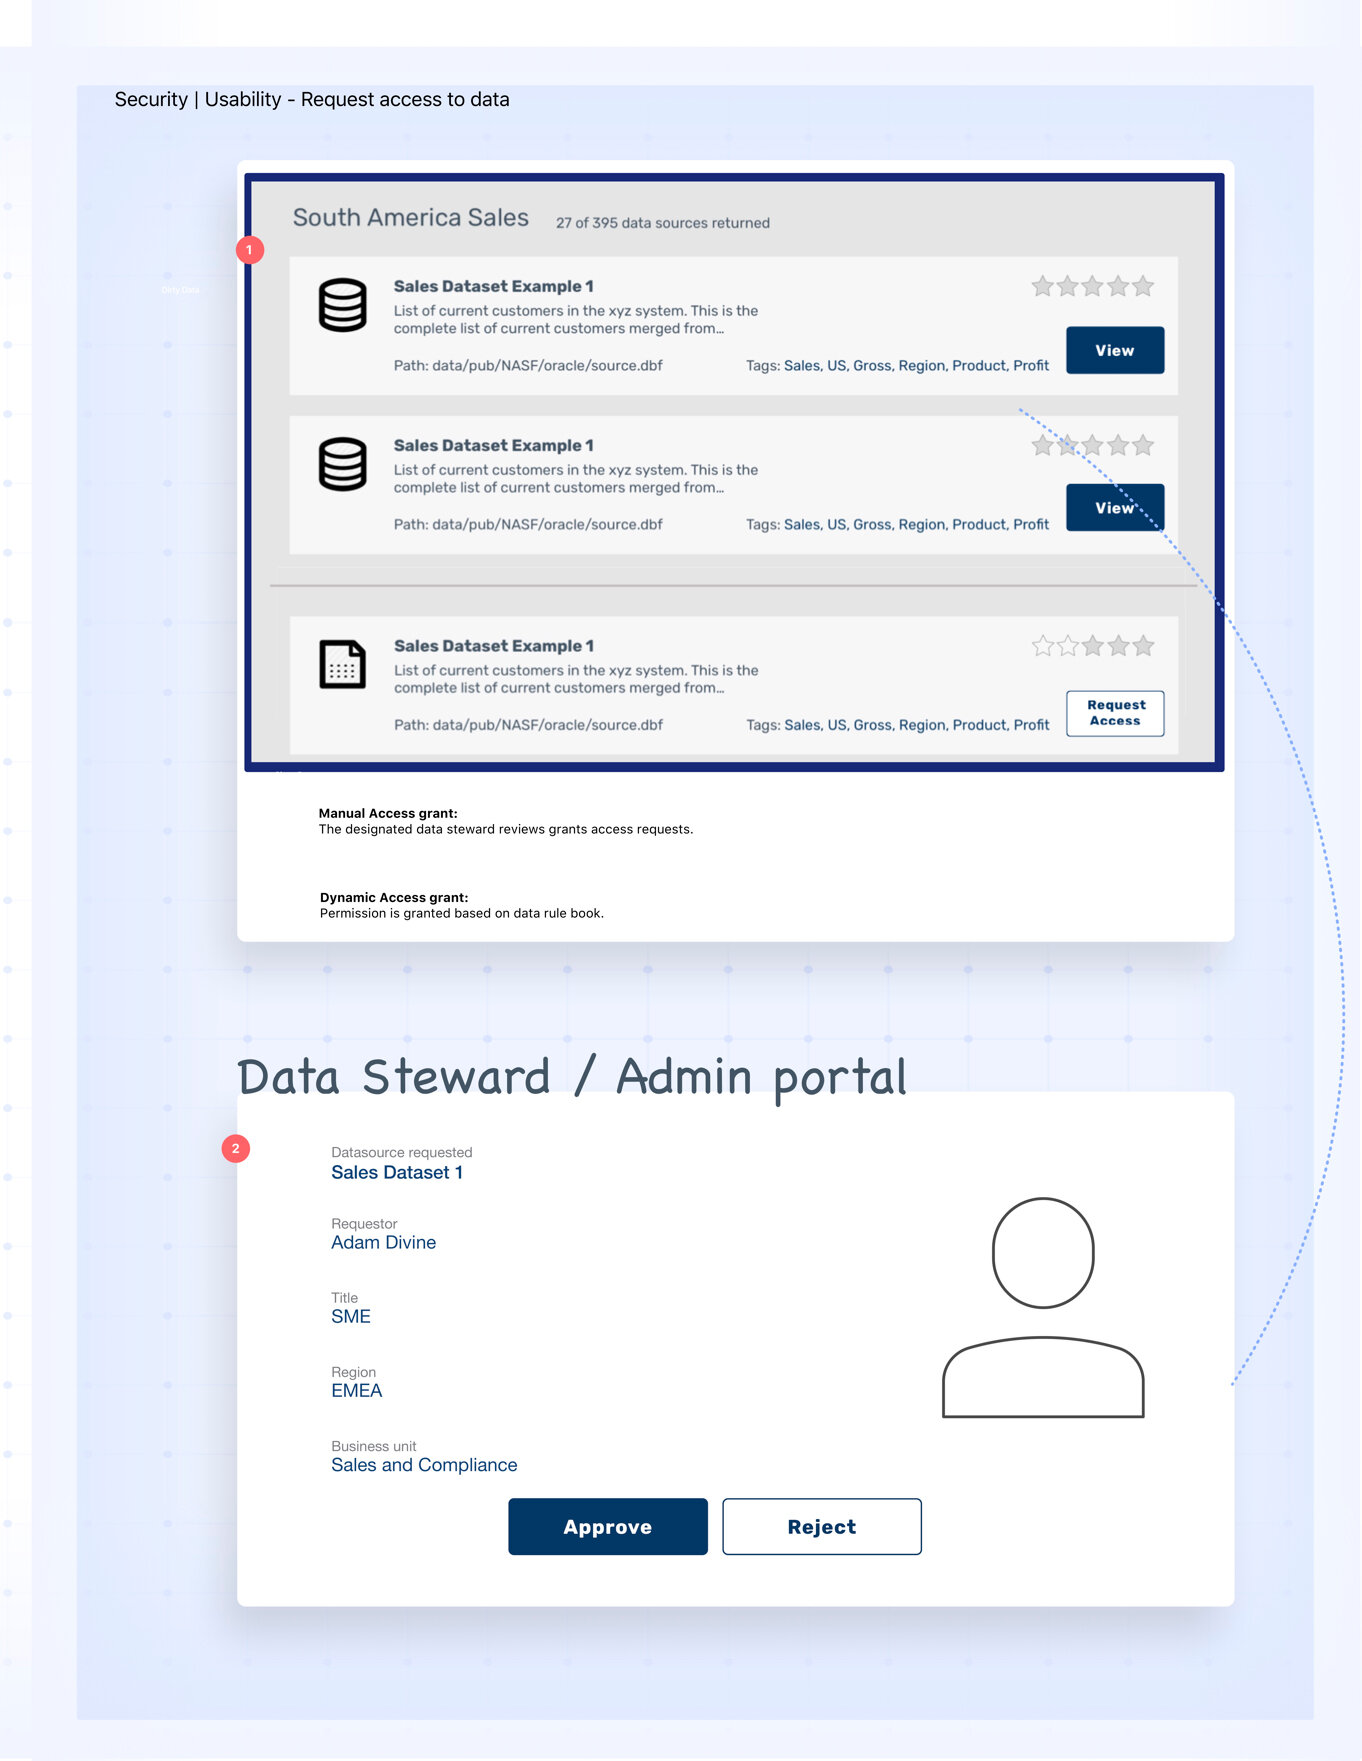
Design probes
I designed the following concepts based on what we learned about data catalogs thus far. We ran these designs with our users to understand their mental model, their current practices, and expectations from a data catalog.
Users Needs:
Find reliable data sources for analytics and reporting
Flag corrupt datasets
Collate datasets and create reports for management needs.
Users would not want to disturb something that they have already built
Stakeholders:
Vertiv’s SMEs
Vertiv’s data team
Vertiv’s developer team
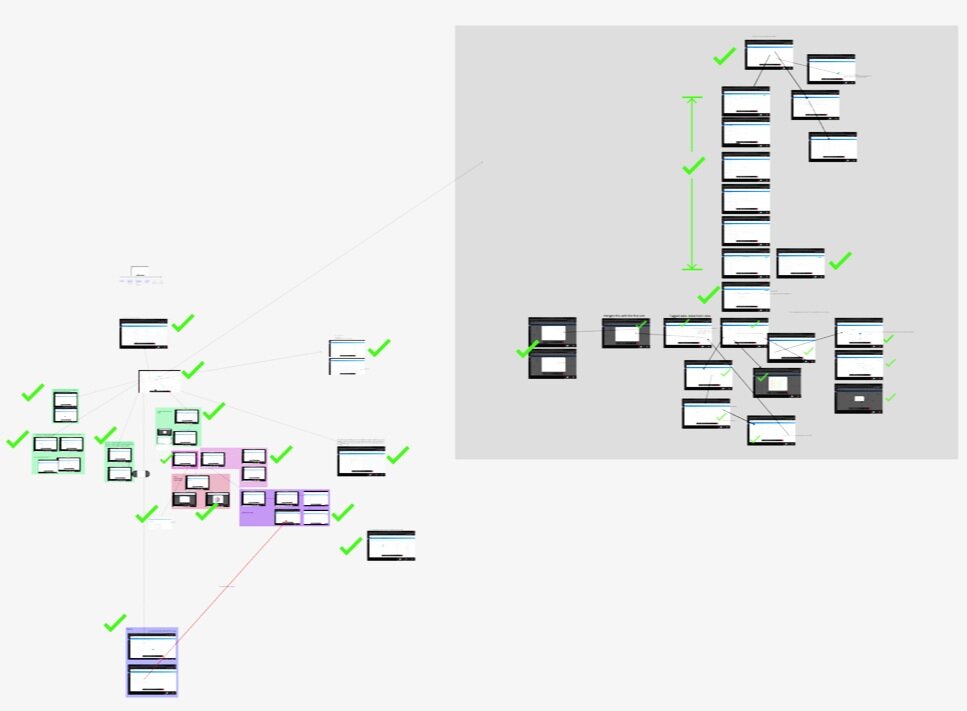
All the product-feature screens grouped and mapped on a figma board
Product Roadmap
The roadmap
Having analyzed all the screens and features of the product, we assessed that the product needed improvement at various levels:
Quick fixes: On-screen changes we need to make to fix the usability issues. These fixes included iconography, vocabulary, terminology, accessibility, adherence to interaction patterns, etc.
Improving overall product experience: These included changes to minimise the learning curve and make the product intuitive and easy to use. We suggested:
Coherent grouping of similar features and categorization of the feature types.
Making important features most accessible,
Suggesting standard and more contextual infographics and visuals to represent data,
Enhancing consistency in Information Architecture,
Creating help, guides, tips, FAQs where needed, etc.
Missing features: Based on the Competitive analysis and SME insights, we also identified several important features that were completely missing in the product, while certain features we identified as less valuable were built with heavy investment. This part of the roadmap involved prioritizing these features based on value.
Quick fixes
Based on the agreed roadmap, I identified several quick fixes and UX/UI changes across all existing screens and features. With the help of our visual designer, we created a detailed InVision handbook, which helped the dev team identify and implement our suggested changes on each screen.
Dashboard page of the inVision handbook we created. All the screens are categorized into features. Users can navigate across screens and different sections and learn about the new categorization.
A clickable prototype showing two of the several screens we recommended enhancements. The screens on the left side are the original screens with suggested enhancements, and the right-side screens visualize those changes. Pink pointers represent quick fixes, while the blue pointers are for future UX considerations.
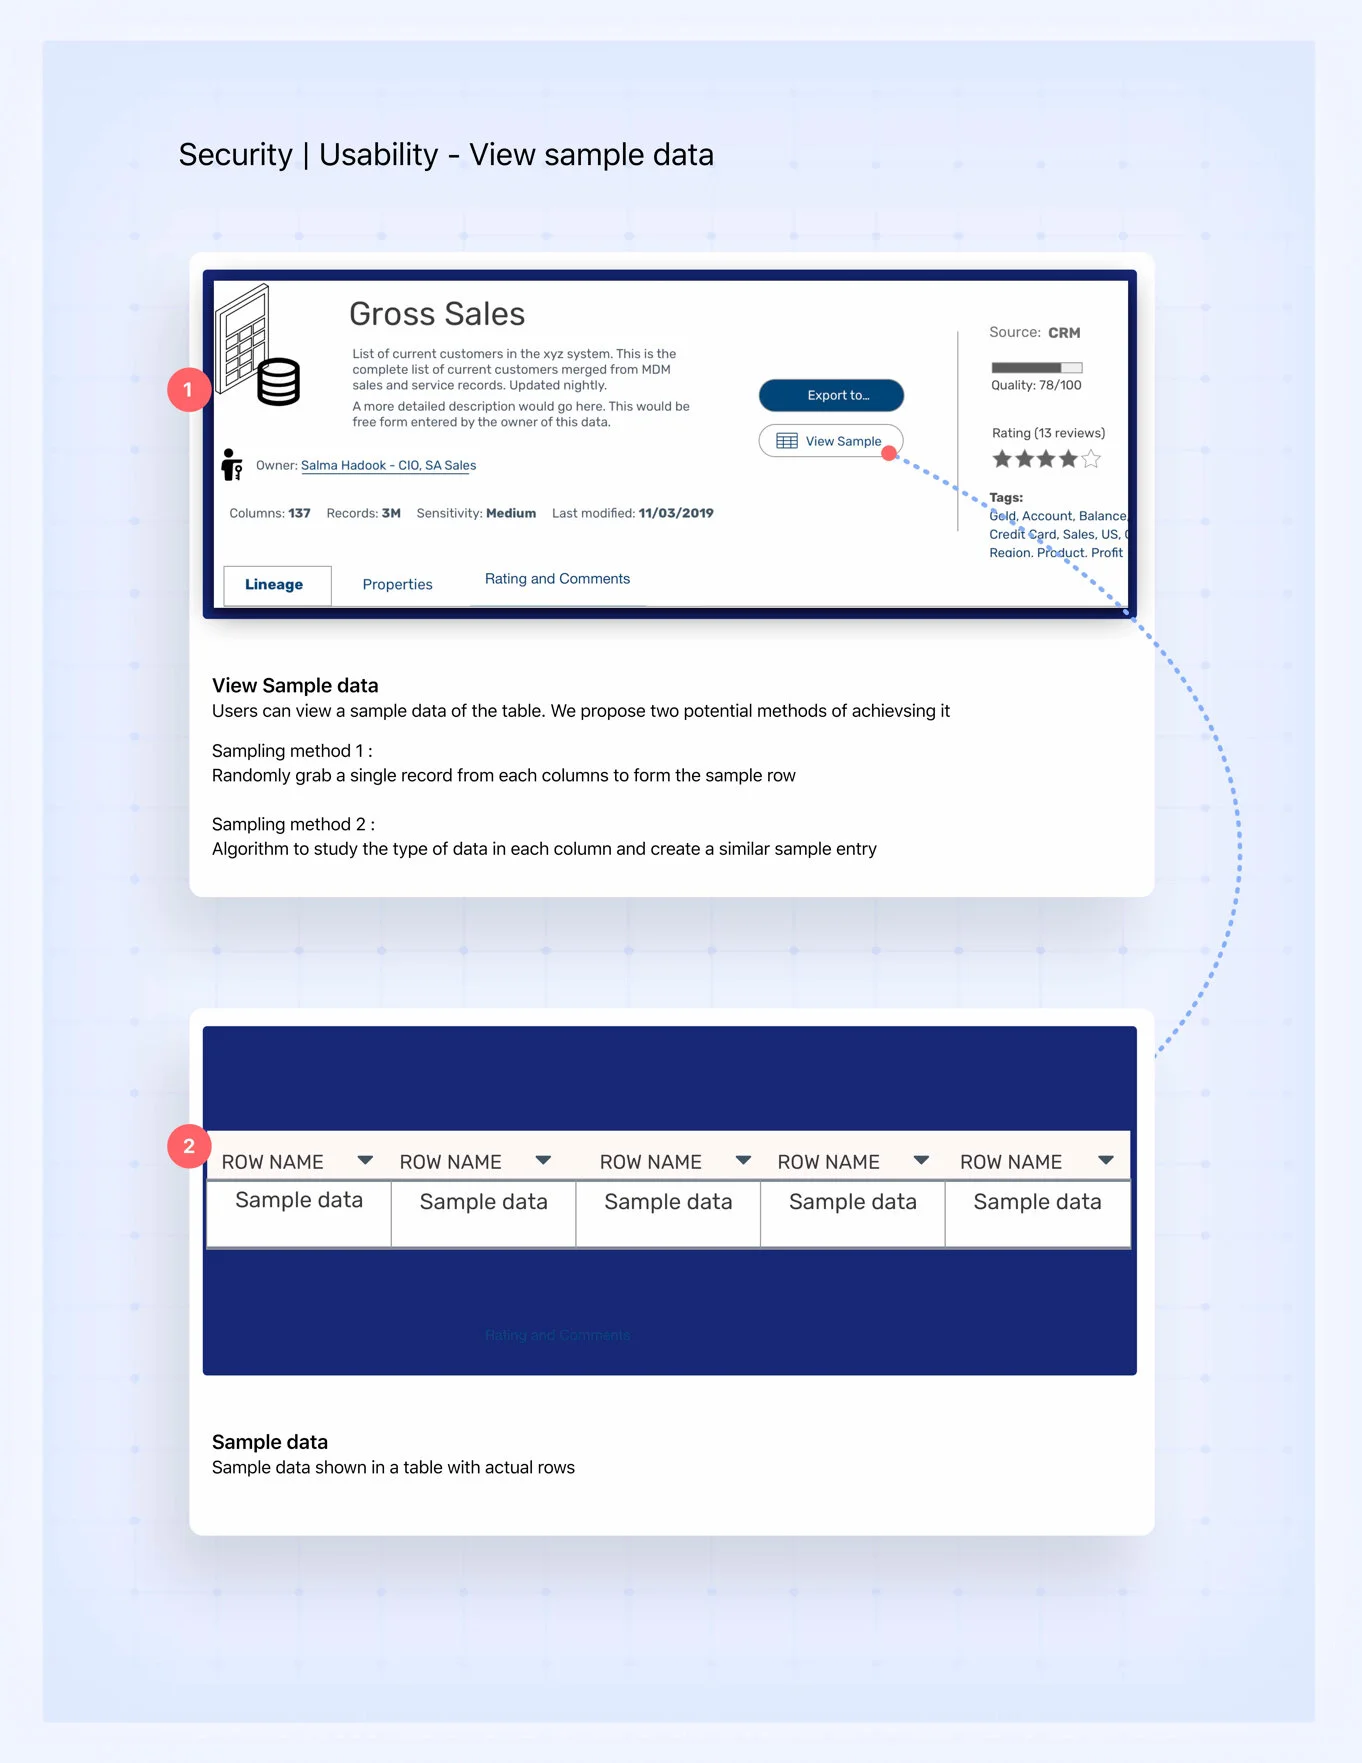
UX Improvements Suggestions
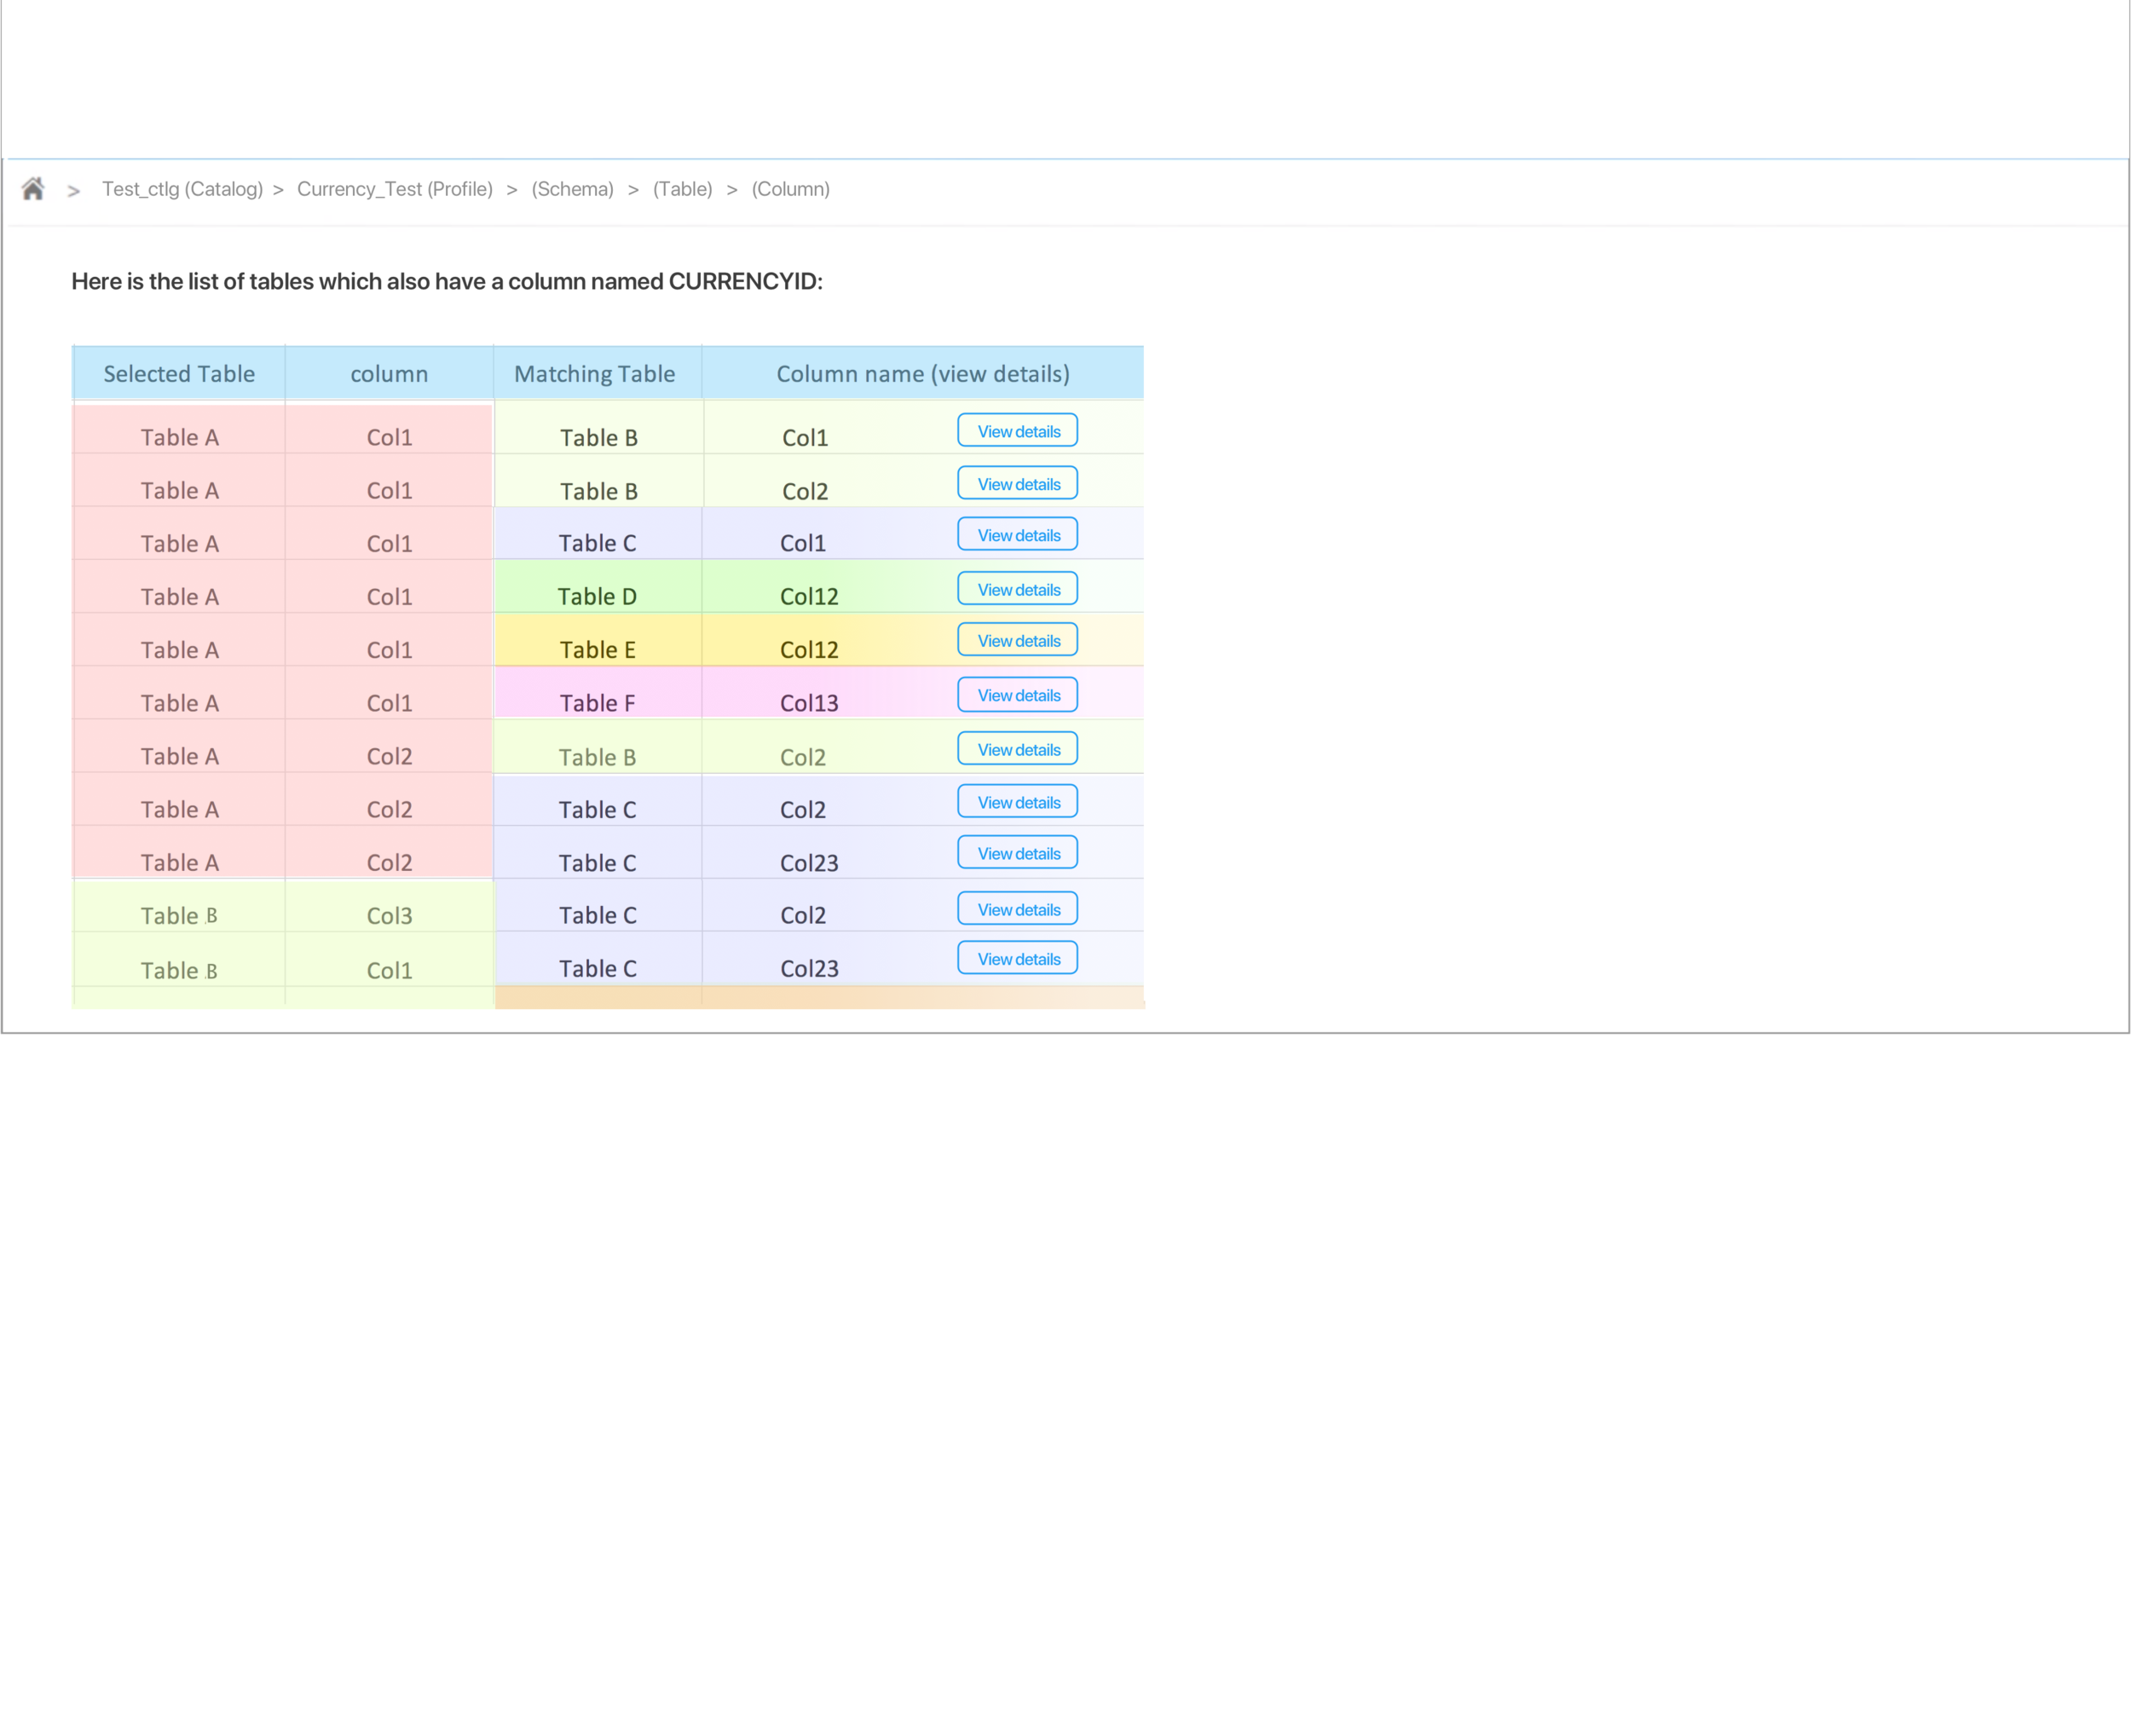
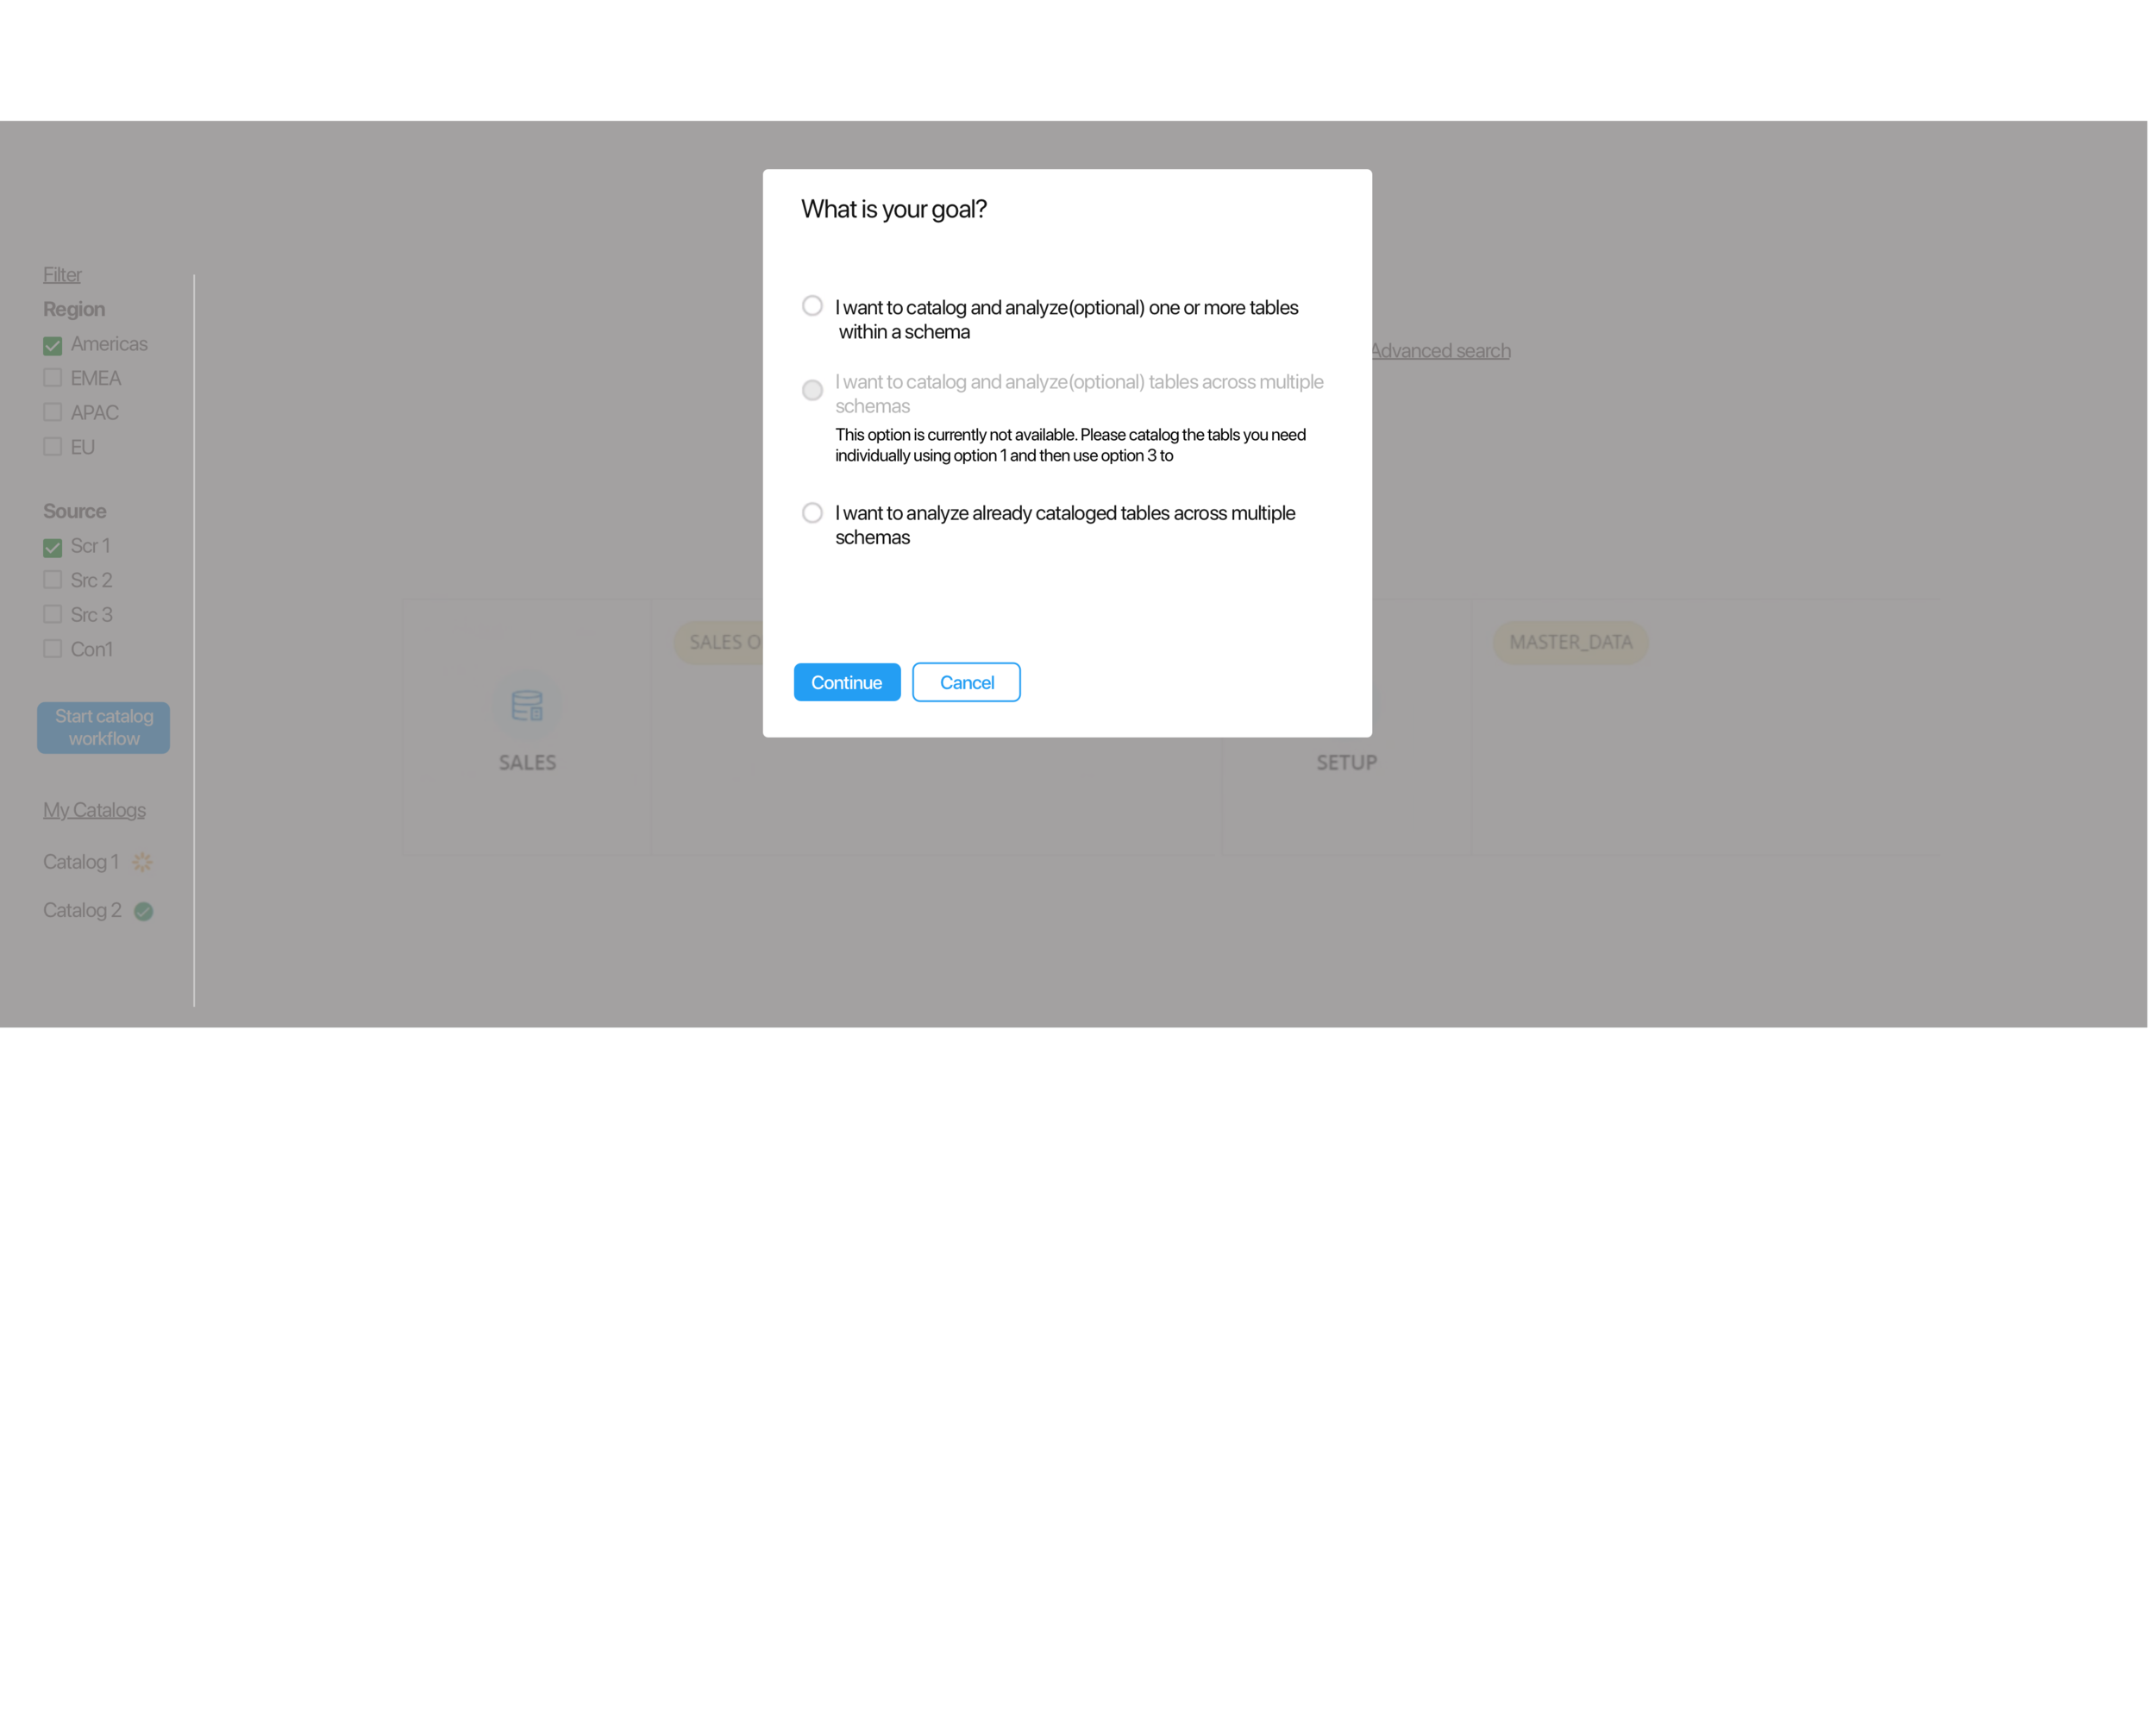
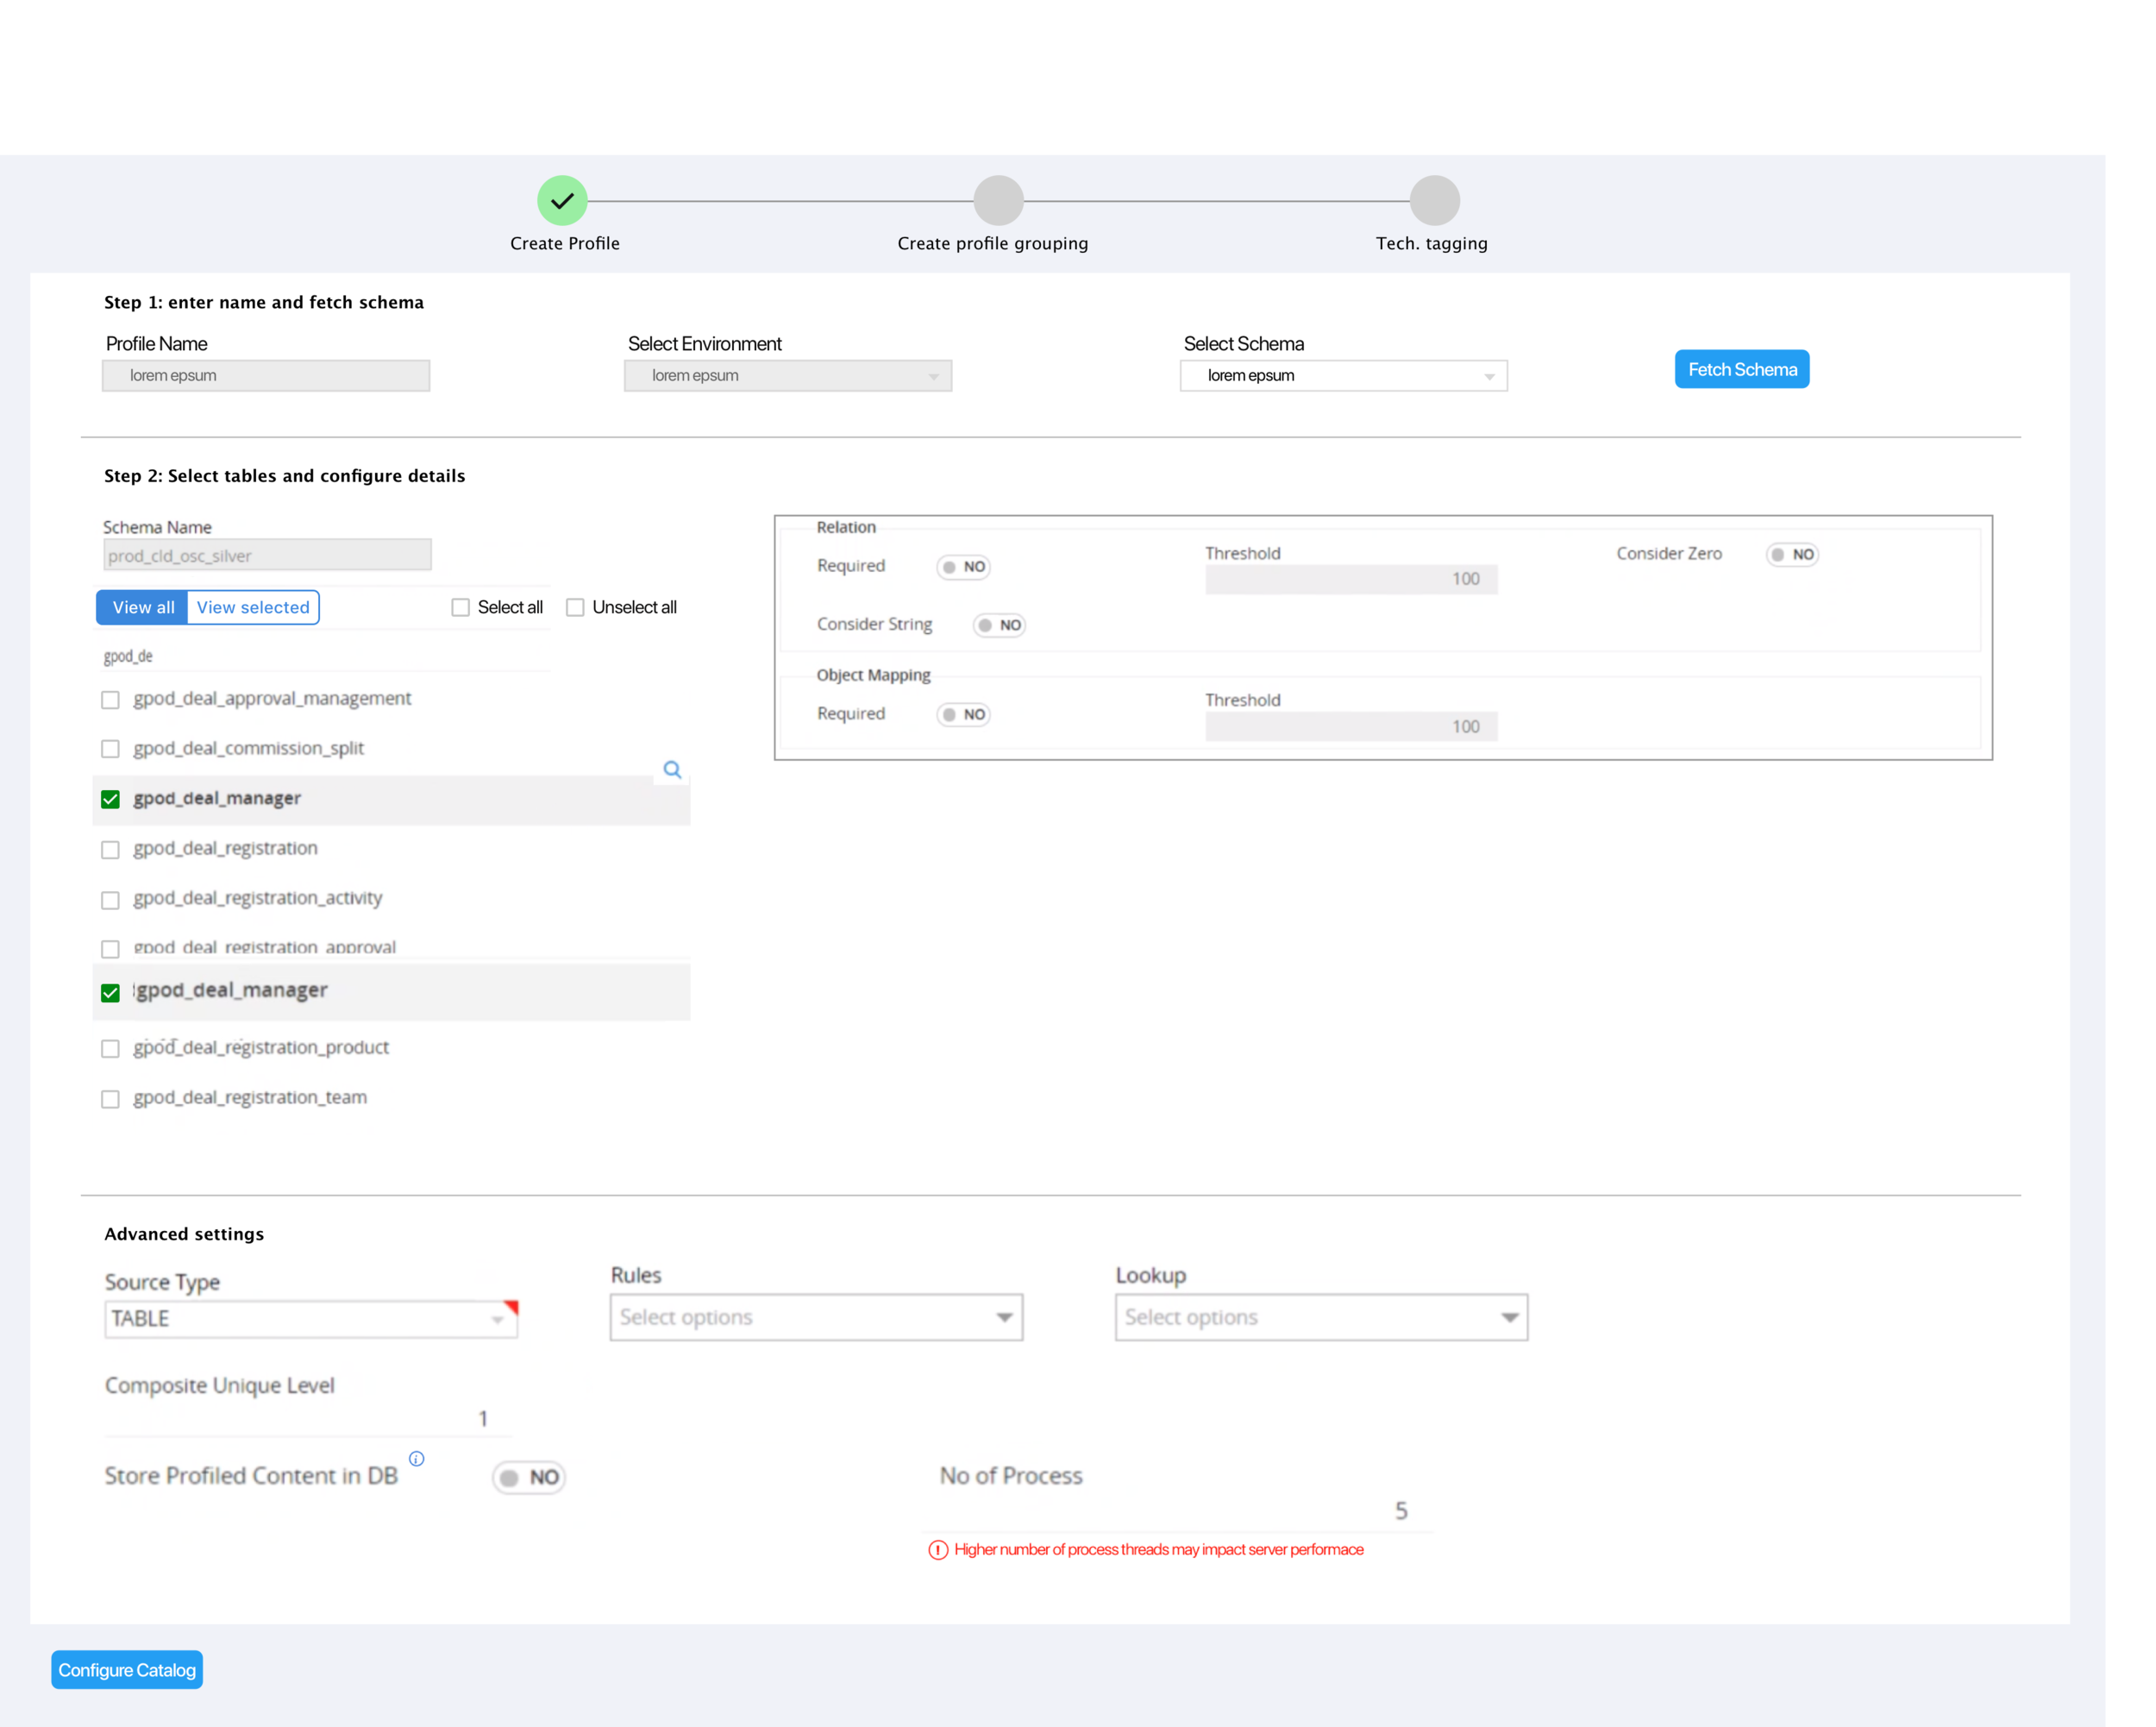
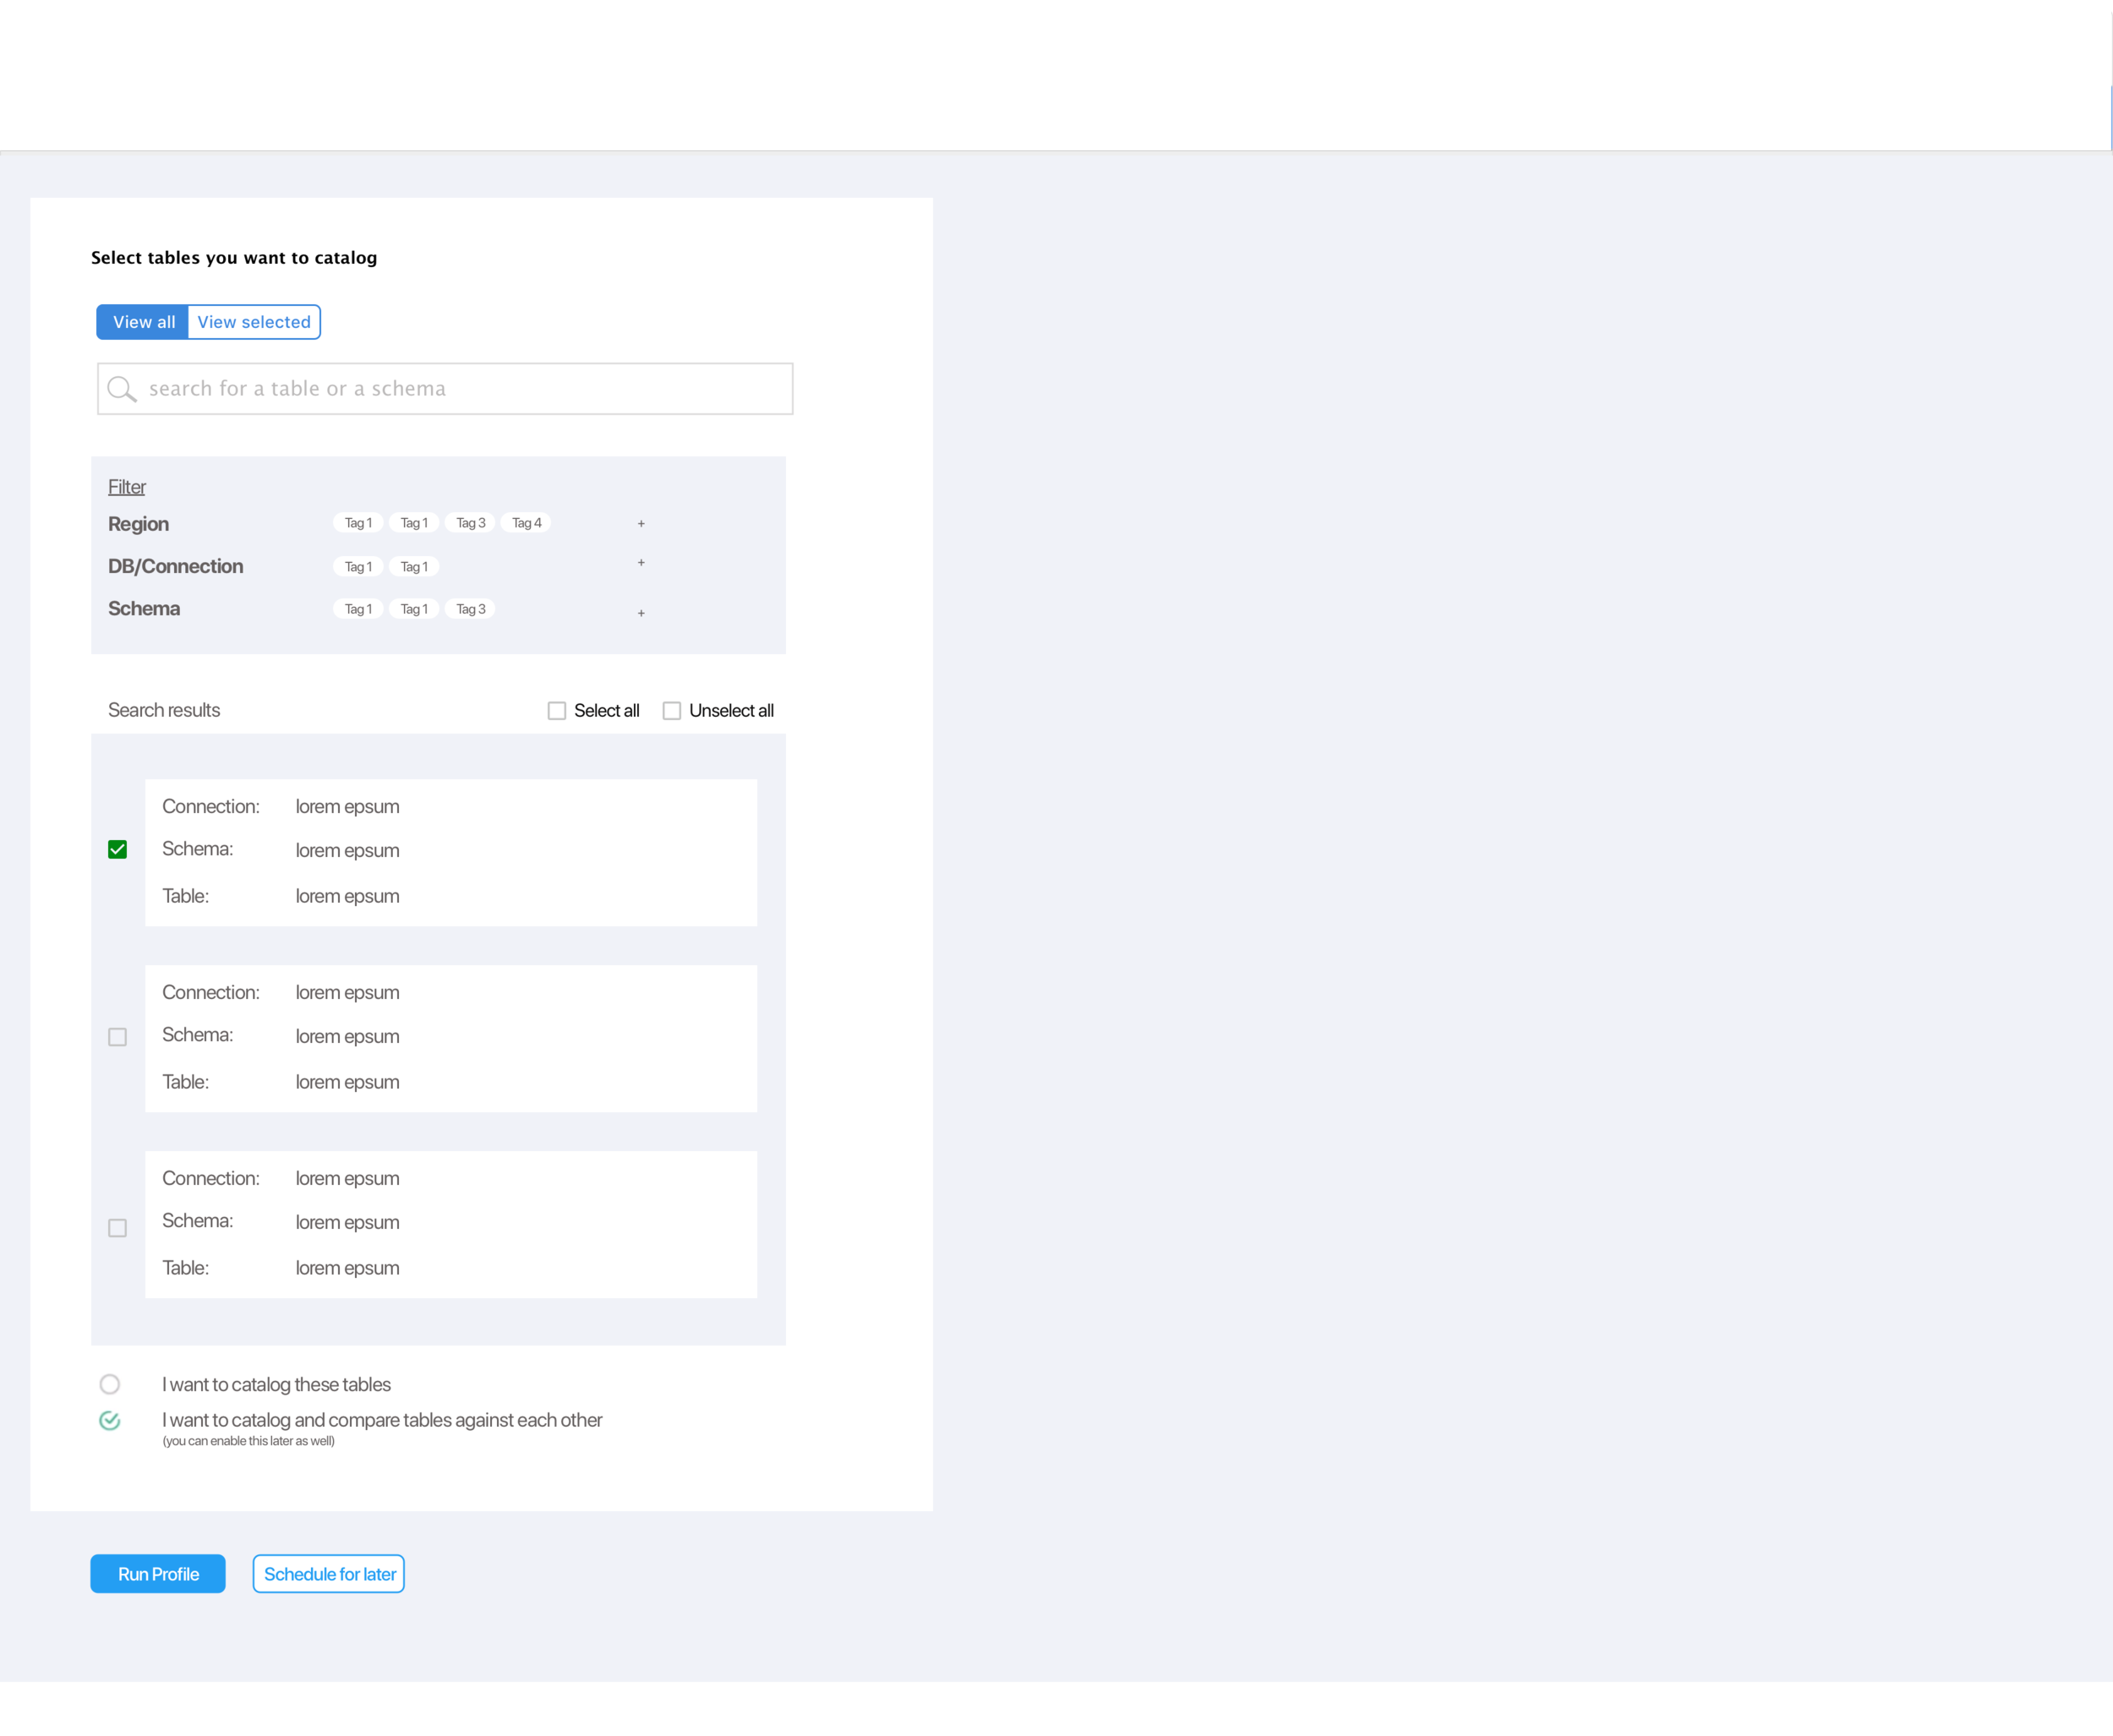
I designed these UX feature improvements based on our findings.
User tasks- I defined certain specific tasks users would perform using the catalog. I kept these tasks in mind when designing solutions.
User wants to catalog or analyse a table or a group of tables (within a schema), (across multiple schemas)
Ford - Process Coach Mobile Companion
Business goal: Improve production quality and FTT.
UX goal: Enable Process Coaches with the critical information they need for managing the lines.
Line status and quality issues, shift notes.
Automate redundant reporting
Digitize people management
Insight for preventing issues

UX and UI Designs - 2019
First National Bank
Marketing website redesign
Customer signups
UI for scheduling appointments
Clients wanted an Amazon shopping cart-like UX.
Duration - 1+ year | 2023-2024
Challenges:
Gain the weary users’ trust over time by meeting their needs and expectations.
Do not introduce new patterns that break their existing routines and mental models.
Easy to use with gloves on.
Minimal learning curve.
Key Bank - Guided Wellness
In-branch Customer consultation UX
Clients wanted a digital onboaring UI that the employee could share with the prospect as part of their financial wellness conversations.
My contribution:
Designed the UI concepts and variations
Freelance | UX and UI - 2023
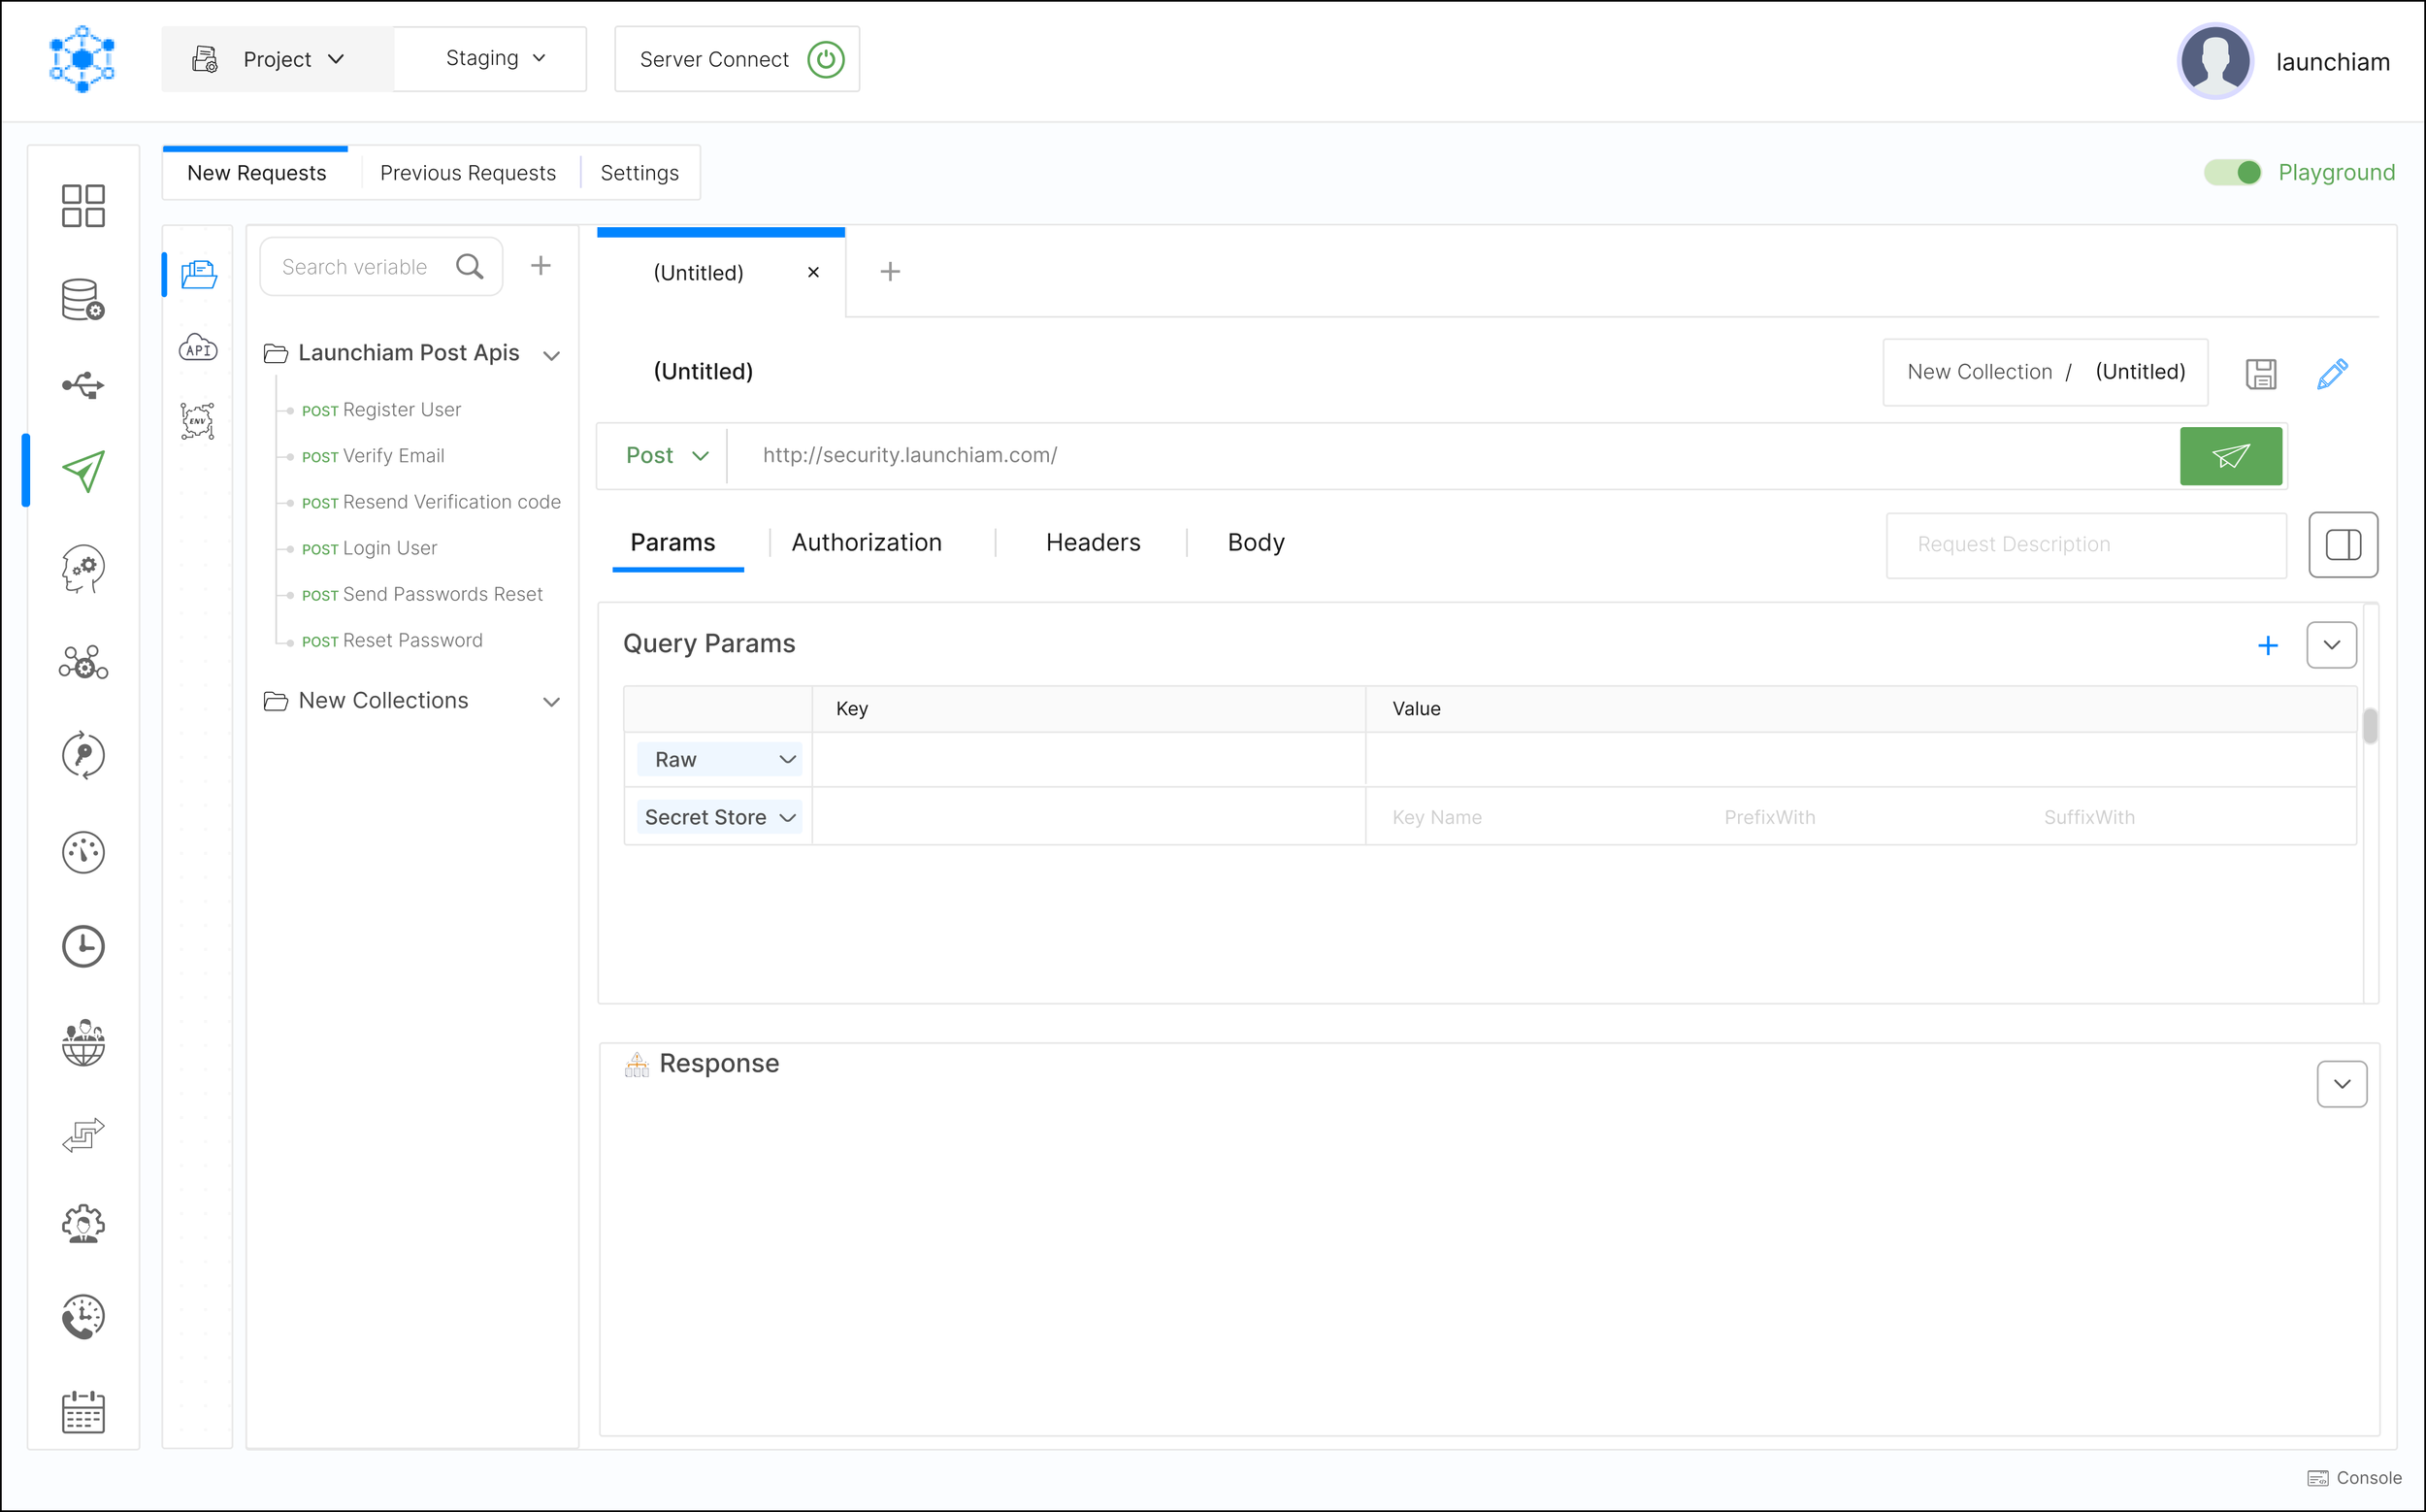
KeyRunner
KeyRunner is a VS Studio API client extension (now pivoted to API-first agentic security).
14000+ installs on VS Code. Free and Paid tiers.
Original design
Revised design with visual hierarchy, clear callout to CTAs, and UI refinement.
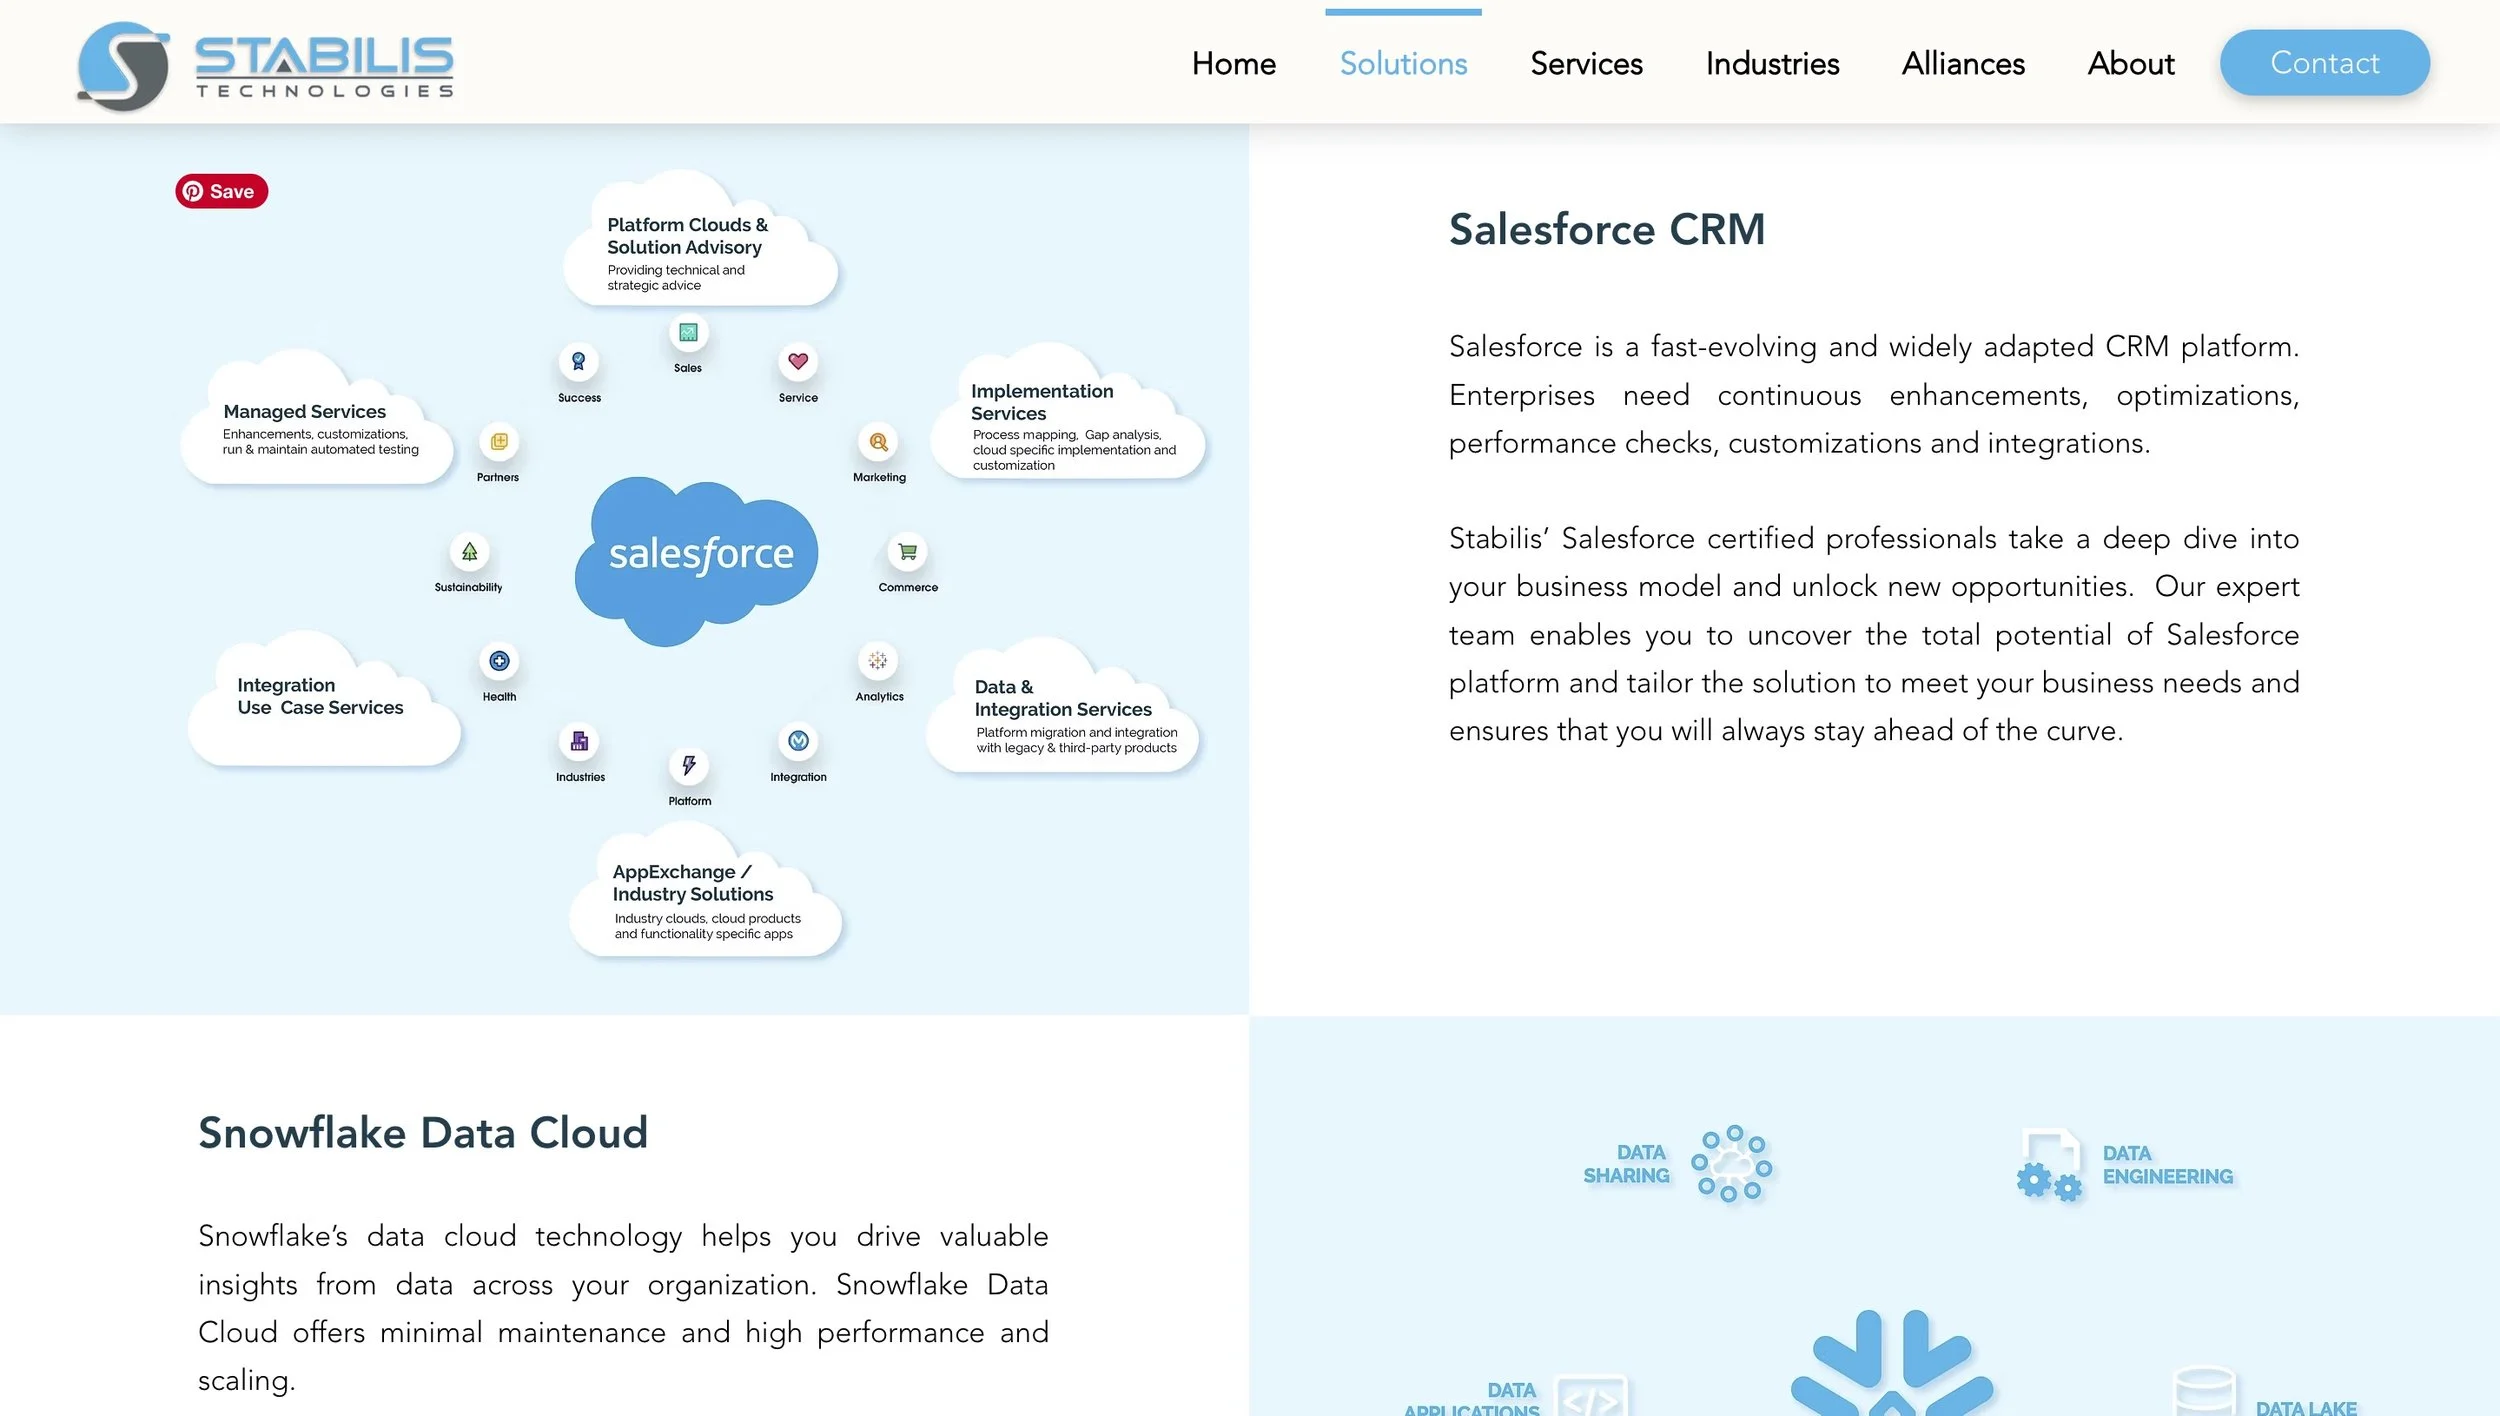
Stabilis Technologies
Designed and built their marketing website.
My contribution:
Revised UI to match contemporary design language
Improved visual hierarchy, clear callout to CTAs, and UI refinement.
Designed dark mode
My contribution:
Assisted with wireframes, mockups
Designed Information Architecture for webpages.
Designed page layouts.